- Research
- Open access
- Published:
Towards a unified customer aware figure of merit for CSP selection
Journal of Cloud Computing volume 4, Article number: 24 (2015)
Abstract
The current cloud computing market lacks of clear comparison between the Cloud service providers (CSPs) offerings. This is due to the heterogeneity in the virtual machines (VMs) configurations and their prices which differ among the CSPs. Big players in the market offer different configurations of fixed size VMs. Cloud customers have to choose the CSP that best fits their requirements. In the actual market, and with the limited performance information provided by the CSPs to the cloud users, the choice of the CSP can be a problem for the customers. In our paper, and in the context of the Easi-Clouds (project I, Easi Clouds. http://www.easi-clouds.eu/) a European ITEA 2 research project, we propose a set of performance tests based on real measurements to classify the CSPs based on their performance score as well as their proposed price. We used a set of benchmarks to test the performances of four VMs’ sizes (Small (S), Medium (M), Large (L), and Xlarge (XL)) from each one of the biggest eight CSPs (Amazon, Softlayer, Rackspace, Google, Microsoft Azure, Aruba, Digital Ocean, Joyent). We try to compare the performance based on seven different metrics (CPU performance, Memory performance, Disk I/O performance, Mean Response time (MRT), Provisioning time, Availability, and Variability). In a second step, we include the price to have a performance vs. price value figure. In a final step, we propose a new method that let the user specify the importance of each performance’s metric as well as the importance of the price to classify the CSPs based on the criterions of the customers. We come up with a unified customer aware figure of merit helping the cloud customers to select the most suitable CSP based on their own requirements.
Introduction
In Cloud computing market, CSPs propose a huge set of services for their clients. These services set by the CSP should match with the customers need. At this point, and due to the vague information about the expected performance (usually described qualitatively), customers need to have more knowledge about these performances. In the context of the Easi-Clouds [1] a European ITEA 2 research project, our work will help the users to select the most suitable CSPs according to their requirements. We cannot say that one CSP is the best of all CSPs. Thus, we try to classify the best CSP for the customers in term of performances and/or price that can be the best for their needs. For example, one CSP can be the best in CPU performance but not in memory performance or maybe is not convenient due to its price. We start our proposal by a set of single benchmarks (performance tests) for different metrics, and for each instance’s size from the eight different CSPs. We then try to classify the CSPs giving a score for each performance metric. In a next step, we model our performance problem into one Radar performance plot with all of the seven metrics. On the other hand, we cannot neglect the price, so we insert the price vs. performance value taking into account the technical and financial aspects of CSP’s services. Finally, we build a new unified customer aware figure of merit for CSPs’ selection that is based on our performance measurements and price information for each single instances in each single CSP. The customer gives his requirements by setting the importance of each performance metric as well as the importance of the price to come up with the best suitable CSP to select. We calculate the weighted arithmetic mean to classify the CSPs based on the evaluated metrics performances and their respective weights. We come up with a Service-Oriented figure of merit helping the Cloud customers to select the most suitable Cloud Service Provider based on their own requirements.
Our paper is organized as follows. “Related work” section states some of the existing related work. We explain the problem and the goal of our paper in “Problem and goal” section. “Performance idea and setup” section deals with the methodology and how we did our study and detailed the used VMs with their configurations and prices. Performance evaluation and results for the different metrics are in “Performance evaluation” section. The global performance view is presented in “Global figure for VMs’ performance” section. The value expressed in a global figure of performance vs. price is in “Value figure for VMs” section. The unified customer aware figure of merit for CSPs’ selection is explained in “Unified customer aware figure of merit for CSPs’ selection” section. We conclude our paper and present some future work in “Conclusion” section.
Related work
In our context, benchmarks corresponds to the application of a software over a virtual machine to provide a specific view of the performance of the machine. Benchmarks simulate the application behavior by imposing a workload on the system to measure specific VM features. Multiple benchmarks are used to evaluate the Cloud performance such as TPC-W (a transactional web e-Commerce benchmark) [2], HPCC (a software suite consisting of 7 basic benchmarks) [3–5], NPB (set of parallel benchmarks to evaluate the performance of parallel supercomputers) [5, 6] or common measurement tools such as ping or iperf [7, 8]. Specific benchmarks have been developed to measure Cloud performance of CPU, memory, disk and network [9, 10] or the VM provisioning time [4, 7, 11]. Li et al. [2] propose a taxonomy of performance for evaluating commercial Cloud services and potential approaches to bring a holistic impression of Cloud services performance through a single figure of merit [12].
Table 1 presents some existing benchmark studies for performance evaluation of the different chosen metrics.
The response time of a java application is measured to evaluate the network performance in [9]. Ubench (Ubench score), Bonnie++, and Iperf benchmarks are used to evaluate the CPU, memory, disk storage, and the network performances in [7]. CPU, Memory and network performances for a High Performance Computing Cluster (HPCC) is considered in [13]. An extended model with 4 providers is considered in [4].
FIO benchmark for disk storage (speed in KB/s), stream benchmark for memory, and simplex for CPU performances are considered by the authors in [3]. In [14], the authors analyze the scalability, using the Yahoo Cloud Serving Benchmark with Cassandra. The mOSAIC Benchmarking Framework [15] for the mOSAIC platform helps developers to compare different cloud provider’s offerings. Authors in [16] evaluate Cache Strategies for Cloud Data Access Using an Enterprise Service Bus. In [17], COSBench: Cloud Object Storage Benchmark is used to benchmark the storage in the cloud only. AzureBench: a benchmark tool destined for the Storage Services of the Azure Cloud Platform is discussed in [18].
A big number of benchmarks is actually used to evaluate each single feature apart or a global overall performance view ([19, 20] and [21]). In our paper, we choose a set of benchmarks to measure the performance of the defined criterions. Our choice covers the majority of the measurable features giving a wide view for the performance of one VM.
The originality of our work is to benefit from all these benchmarks’ measurements and come up with a single performance and value figure for all the considered cloud instances in a first step. In a second step, we propose a unified customer aware figure of merit for CSPs’ selection.
Problem and goal
Nowadays, multiple cloud service providers (CSPs) are offering their services in the cloud computing market. Each CSP has its own set of service specifications and prices. The question that we try to answer is how the customer will choose the appropriate CSP when:
-
1.
There is no clear comparison between VMs: The fact that each CSP has its own virtual machines specifications, configurations, and prices gives a kind of confusion for the Cloud customers.
-
2.
There is no quantitative performance evaluation is given for the customers. The CSPs give a general description about the performance (Very good, moderate, etc.).
Our goal is to present in this paper a new customer aware figure of merit to help the customers select the suitable CSP according to their requirements. The new customer aware figure of merit will allow the customers to compare the performances as well as the given value across CSPs. Customers will be able to set their requirements and get in return the CSP that fits better their requirements.
Performance idea and setup
Our evaluation methodology will be presented in this section before presenting the configurations and the prices of the used VM instances.
Evaluation process
Our evaluation process includes 6 steps (Fig. 1) to solve the problem mentioned in “Problem and goal” section.
-
Choose the CSPs and the virtual machines (“Cloud instances configurations and pricing” section): In our paper we choose 8 CSPs (Amazon, Softlayer, Rackspace, Google, Microsoft Azure, Aruba, Digital Ocean, Joyent). For each CSP we consider 4 comparable instances sizes (S, M, L, and XL).
Fig. 1 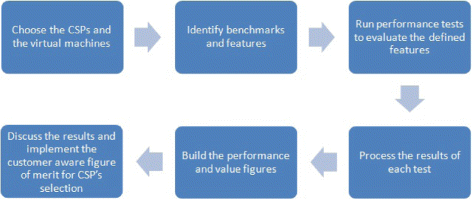
Evaluation process
-
Identify benchmarks and features (“Performance evaluation” section): We identify 7 metrics to evaluate the performances of the VMs. For each metric we select the relevant benchmark to test the appropriate feature. The price is considered as an additional metric driving the value of the VMs.
-
Run performance tests to evaluate the defined features (“Performance evaluation” section): At this stage we run our benchmarks on the different VMs for several times to get the performance results.
-
Process the results of each test (“Performance evaluation” section): We present the results to compare the performances of each measured feature.
-
Build the performance and value figures (“Global figure for VMs’ performance” section): We give a score for each metric and build a radar figure for all the performances into one figure. Also, we calculate a single performance score with a single price score to build a value figure.
-
Discuss the results and implement the customer aware figure of merit for CSPs selection: In this last part, we discuss the results we get from previous stages. We come up with a unified customer aware figure of merit for CSPs selection by letting the customers set the importance of each performance metric as well as the price (“Unified customer aware figure of merit for CSPs’ selection” section).

Cloud instances configurations and pricing
We used 4 instances sizes (S, M, L, and XL) for each CSP. Table 2 presents the evaluated VMs’ configurations and prices for 8 different CSPs. These configurations and prices are set by the CSPs. This table shows that the hourly price in USD and the configuration is different among CSPs. The hourly price of a small instance from Amazon is 0.07 USD/h while it is 0.09 USD/h for Microsoft Azure. Also, for the small instance from Amazon the disk storage is 4 GB while it is 70 GB for Microsoft Azure. On the other hand the memory of the small instance is 3.75 GB for Amazon and 1.75 GB for Microsoft Azure. We cannot find exactly the same configuration and price for one VM with two different CSPs.
Performance evaluation
In this section, we present the results of the different used benchmarks (Fig. 2). We apply our benchmarks on several virtual machines for several times. We identify seven metrics related to seven of the main features of the selected virtual machines as shown in Fig. 2. To evaluate these features, we test seven metrics: CPU performance, Memory performance, Disk I/O performance, Mean Response time (MRT), Provisioning time, Availability, and Variability. The average value is calculated with the variability of the measurements expressed with Relative standard deviation (RSD) or with the error bars in the figures. Some benchmarks have the higher value better (HB) such as the CPU performance when using Pystone [22] that measure the CPU performance in number of iterations per second. A higher Pystone result indicates better overall performance. Others have the lower value better (LB) such as the variability. A lower variability indicates a lower variation in the taken performances measurements.

VMs performance evaluation
Computation performance
The computation performance refers to the property of processing data into one virtual machine, and it corresponds to the virtual CPU performance evaluation in our case. Sysbench [23] provides benchmarking capabilities towards Linux. It supports testing CPU, memory, and File I/O. We use it to benchmark the CPU computational performance.
Sysbench will measure the total execution time and the total time of a running CPU workload. This is done by a series of operations or calculations that consume the CPU power. The less execution time, the better the CPU performance. The benchmark can be configured with multiple threads. In this case, the execution time will be the sum of the execution times of all threads. The results of the Sysbench CPU benchmark are in Fig. 3. The results show that the computation performances differ between the instances of the same CSP. For example, Rackspace has the best performance for the small instances, but not the best for the other instances’ sizes.

CPU benchmark with Sysbench
PyStone [22] is an extremely high-level benchmark distributed with CPython. For a given machine (VM in our context), Pystone measures the number of pystones (iterations) per second that can be run over the machine. A higher number of pystones per second indicates a better performance of a Python interpreter. Different implementations of the benchmark can be made. By default pystone runs 50,000 passes to determine PyStones per second. The results in Fig. 4 were generated using this default. The results show that the computation performances differ between the instances of the same CSP which was also shown in Fig. 3. We used two benchmark to compare the results for the measured performance taking into account two different measurements.

CPU benchamrk with Pystone
Memory performance
The memory performance refers to the property of storing data on a temporary basis, and it corresponds to the evaluation of the VM RAM in our case. The STREAM benchmark is a simple synthetic benchmark program that measures sustainable memory bandwidth (in MB/s) and the corresponding computation rate for simple vector kernels [24]. The default array size is 2 million elements and the default offset is 0 elements. This can be modified allowing some flexibility in the runs.
Sustainable memory bandwidth has a clear and intuitive interpretation. It is used for the performance evaluation of computer systems especially in high performance computers where we have a high cpu and memory speeds. It is not simple to determine a sustainable memory bandwidth as many complex architectural factors can affect it.
We apply the Stream benchmark (Table 3) to our virtual machines. The results below are for all the tested operations: Copy (Fig. 5), Add (Fig. 6), Scale (Fig. 7), and Triad (Fig. 8). The results show that the performance differ between the CSPs in the market. This can be due to the different hardware used by the CSPs. The different operations tested by the benchmark show multiple actions and their application in the memory of the different virtual machines. The ranking between the CSPs differ also between the instances’ sizes.

Memory benchmark for Copy operation

Memory benchmark for Add operation

Memory benchmark for Scale operation

Memory benchmark for Triad operation
Disk input output (I/O) performance
The disk I/O performance refers to the property of storing data on a permanent basis, and it corresponds to the evaluation of the VM Disk storage in our case. Bonnie [25] performs a series of tests on a file of known size. For each test, Bonnie records the transfer rate expressed is kilobytes per second.
The idea is to make sure that these are real transfers between user space and the physical disk. The tests are mentioned in Table 4.
-
Sequential Output:
-
1.
Per-Character: Bonnie writes the file using the putc()stdiomacro invocations, and records an output rate per character expressed in KB per second (Fig. 9). A CPU overhead is needed for the Operating system (OS) file space allocation and the stdiocode.
Fig. 9 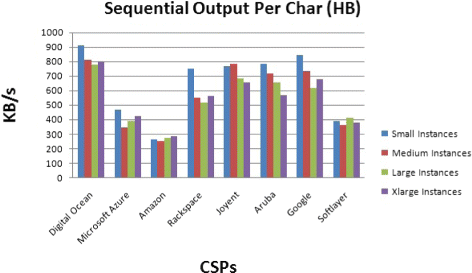
Disk storage benchmark for sequential Output per Char operation
-
2.
Block: As a part of sequential output performance, the file is written using write(). Bonnie use block writes while reading the file and reports an output rate per block in KB per second (Fig. 10).
Fig. 10 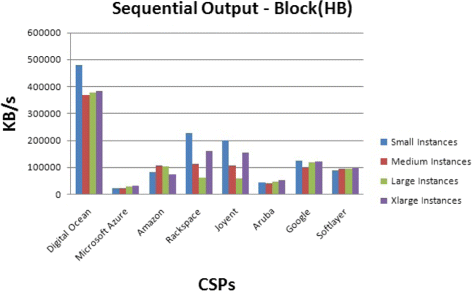
Disk storage benchmark for sequential Output Block operation
-
3.
Rewrite: In this sequential output performance test, the file is divided into parts. Each part is read with read(), dirtied, and rewritten with write(). This requires an lseek() which is used to change the location of the read/write pointer of a file descriptor. Bonnie tests the effectiveness of the filesystem cache and the speed of data transfer. Bonnie records the ability to cover in KB per second (Fig. 11) while creating, changing the blocks, and rewriting them in the file.
Fig. 11 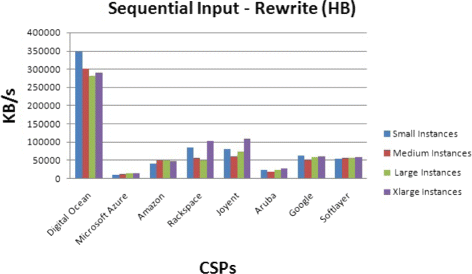
Disk storage benchmark for Rewrite operation


-
Sequential Input:
-
1.
Per-Character: Bonnie reads the file using the getc()stdiomacro invocations, and records an input rate per character expressed in KB per second (Fig. 12). The stdio is exercised here as a part of sequential input performance.
Fig. 12 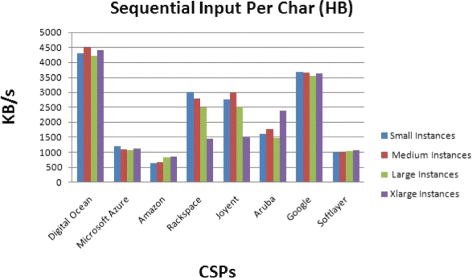
Disk storage benchmark for sequential Input per Char operation
-
2.
Block: As a part of sequential input performance, the file is read using read(). Bonnie use block reads while reading the file and reports an input rate per block in KB per second (Fig. 13).
Fig. 13 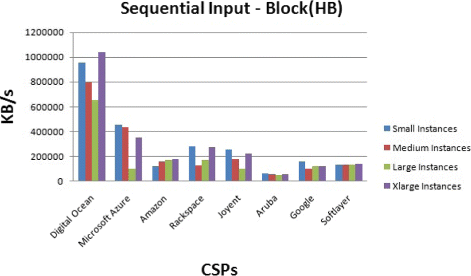
Disk storage benchmark for sequential Input Block operation


The results show that the different operations have not the same performances among the CSPs. For example, the sequential output per character speeds are different from the sequential input per characters speeds. Also, Digital Ocean has the highest performance. These results can be due to the information caching done by the CSP.
Mean response time (MRT)
It is used to test the network performance. The Mean response time represents the Round Trip Time (RTT) that took a ping of one CSP’s virtual machine’s address. It is expressed in milliseconds (ms). The MRT is a LB benchmark. The lowest MRT indicates the fastest response time. Figure 14 presents the MRT of the different CSPs from France. The results show that Aruba has the lowest MRT. This can be explained by the fact that the Aruba’s datacenter is the nearest to France where the test is applied.

CSPs median response time
Availability
The availability is the percentage of uptime duration over a defined interval duration. It is expressed with the following equation:
The data is taken from Cedexis [25] statistical measurements for the chosen CSPs. The results are presented in Fig. 15.

CSPs availability
The availability can be different from one region to another for the same CSP. It is important for the CSPs to guarantee the highest level of availability for the customers services.
Variability through relative standard deviation (RSD)
Variability expressed the variation in the taken performances measurements for each benchmark. Variability is expressed with the Relative Standard Deviation (RSD) value. Each benchmark measurement has its own RSD. RSD is calculated from the data collected through all the measurements done for one metric. It is given by the following equation:
where N is the total number of measurements, x 1,…,x N are the measured results, and E(x) is the mean of those measurements.
Figures 16 and 17 present some single variability values for CPU benchmark measurements.

CPU variability with Pystone

CPU variability with Sysbench
Figures 18, 19, 20, and 21 present some single variability values for Memory Copy, Add, Scale, and Triad benchmark measurements respectively.

Memory variability for Copy operation

Memory variability for Add operation

Memory variability for Scale operation

Memory variability for Triad operation
Figures 22, 23, 24, 25, and 26 present some single variability values for Disk storage benchmark measurements.

Disk storage variability for sequential Output Block operation

Disk storage variability for sequential Input Block operation

Disk storage variability for sequential Input per Char operation

Disk storage variability for sequential Output per Char operation

Disk storage variability for Rewrite operation
The importance of the results is to show how the obtained results for the studied metrics’ performances can vary during the usage time of the virtual machine. The average value of the variability is calculated and presented in the continuation of our paper.
Provisioning time
Provisioning Time is also called scaling latency. It is defined as the time taken by a CSP to allocate a new VM once the customer requested it. It is the sum of the resource allocation time for the VM request, and the time to power on the VM to get it ready for use. The provisioning time has a direct impact on the scalability of one cloud based application. A CSP must insure a tolerable provisioning time to follow the variation in workload that one customer needs. The provisioning time for all VM size is measured for all CSPs (Fig. 27). The provisioning time for all the studied virtual machines is less than one minute. It is important to have a short provisioning time for the recovery in case of a disaster on one virtual machine or datacenter.

CSPs provisioning time
Other metrics
Multiple additional metrics can be investigated in the Cloud computing market. These elements can affect the selection of the CSP by the customer. In this paragraph we cite some of the possible additional considerations such as:
-
1.
Service Storage Capabilities: CSPs do not offer the same storage capabilities. For instance, the drive types can be different. The storage process could be local or external and both has pros and cons on the performance.
-
2.
Networking Capabilities: All CSPs support basic network capabilities allowing the customers to connect to their instances using an internet Protocol version 4 (IPv4). Additional capabilities can be offered by one CSP to attract the customers such as IPv6 support, multiple IPv4, and private IP address. Also, Load Balancing services can be offered.
-
3.
Data Center Locations: Cloud customers have the possibility to choose the best region(s) to deploy their applications according to their needs. Depending on the need, one customer could prefer to deploy the application on multiple servers in multiple regions. Multiple CSPs are not present in some regions (e.g. Australia).
-
4.
Security Features: Security is an important issue for the cloud customer. The importance of security features could vary depending on the application. Cloud customers expect from the CSP to protect their data and restrict unwanted access. In this matter, CSPs can offer Firewalls, Virtual private network (VPN), or other security features.
Global figure for VMs’ performance
This section sum up the benchmark results of the previous section and presents a global performance view for the CSPs’ instances.
Simple figure of merit
In a simple figure of merit, each performance metric is taken into account independently of other metrics. It is calculated for each metric apart. In this model, the score of one metric is scaled between two fixed values (X and Y). X corresponds to the lower bound with the lowest score and Y corresponds to the upper bound with the highest score. The measured values are then averaged to calculate the performance score which is given by the following equation:
Radar performance figure
The performance scores calculated for each metric with the Eq. 3 are merged together into a radar performance figure. Figures 28, 29, 30, and 31 illustrate the results using the radar plot for different instances’ sizes.

Radar performance figure for small instances

Radar performance figure for medium instances

Radar performance figure for large instances

Radar performance figure for xlarge instances
The Radar performance figure gives a global performance view of the different instances types offered by the CSPs. The performance differs within the same CSP with the different instances’ sizes. The importance of the different metrics are considered the same in our radar performance figures. The score for the studied metrics differ between the instances’ sizes. For example, Rackspace has the highest score for the CPU for the small instances, but Google has the highest score for the CPU for the medium instances. The radar performance figure will let the user choose the best CSP according to the needed performance of the demanded metric.
Value figure for VMs
In this part, we unify the performance score to a unique value considering an average single score along with the price score. We come up with a 2 axis figure describing the trade off between the performance and the price. The size of the circle presents the average variability of the measurements. Of course, the best for the customer is the highest performance with the lowest price. The highest performance is for a value of 1 on the performance axis, and he highest price is for a value of 1 on the price axis. In Figs. 32, 33, 34, and 35, we present the results for different instances sizes.

Value figure for small instances

Value figure for medium instances

Value figure for large instances

Value figure for xlarge instances
We can notice that the value of one CSP is not the same within the different instance sizes. For example, there is a big difference between Rackspace performance vs. price value for small and xlarge instances. This is due to the difference in performance and prices of the instances within the same CSP. The value figure let the user decide which CSP offer the best balance between the performance and the price.
Unified customer aware figure of merit for CSPs’ selection
At this stage the customer defines the weights of the investigated performance metrics as well as the price. Our model calculates the score of each CSP using the Weighted arithmetic mean. Thus, metrics with a high weight contribute more to the weighted mean than do metrics with a low weight. The weights cannot be negative. Some may be zero, but not all of them. The weighted mean of a set of data { S c o r e CPU , S c o r e Memory , S c o r e Storage ,..} with non negative weights is given by the following equation:
Each CSP will get the appropriate performance score and price. The customer can now easily choose the CSP that best fits his requirements based on the entered weights. Here are two examples to help the customer selecting the CSP:
-
1.
CPU-intensive application: In this scenario, the customer is willing to have a high CPU performance for the application. We increase the priority (importance) of the CPU performance metric. The CSPs’ classification scores for this scenario are given for performance score and the price. The results are presented based on the VMs sizes: Small instances (Fig. 36), Medium instances (Fig. 37), Large instances (Fig. 38), and Xlarge instances (Fig. 39).
Fig. 36 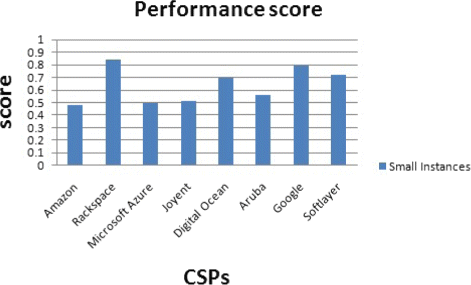
Performance score for small instances
Fig. 37 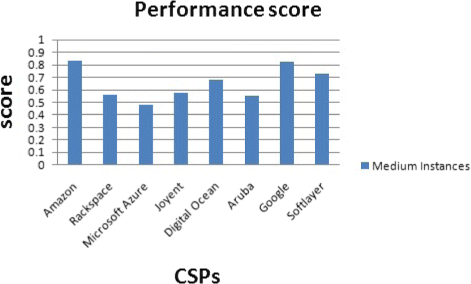
Performance score for medium instances
Fig. 38 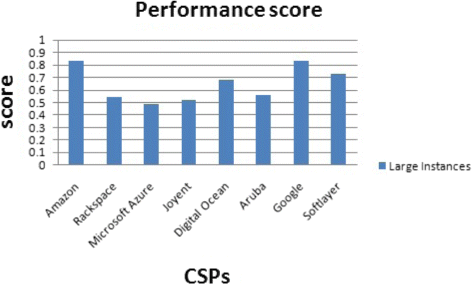
Performance score for large instances
Fig. 39 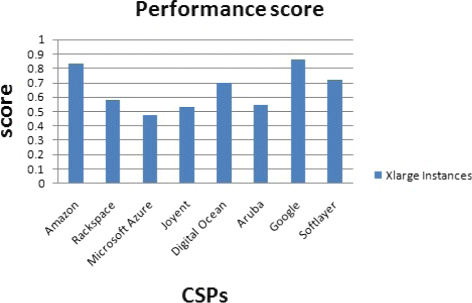
Performance score for xlarge instances
One CSP can be the best according to the performance score but not the best when dealing with the performance and price score. For example, for a CPU-intensive application with small instance size, Rackspace gets the highest performance score and Digital Ocean the fourth place (Fig. 36). But, Digital Ocean has the lowest price for small instances.
-
2.
Memory-intensive application: It is an application with high memory performance demand. We increase the priority (importance) of the Memory performance metric. The CSPs’ classification scores for this scenario are given for performance score and price. The results are presented based on the VMs sizes: Small instances (Fig. 40), Medium instances (Fig. 41), Large instances (Fig. 42), and Xlarge instances (Fig. 43).
Fig. 40 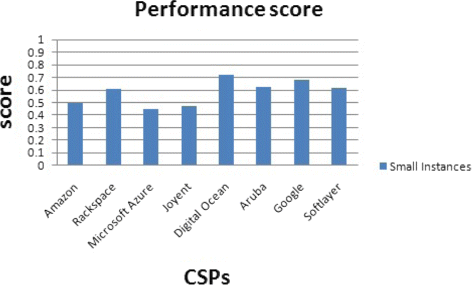
Performance score for small instances
Fig. 41 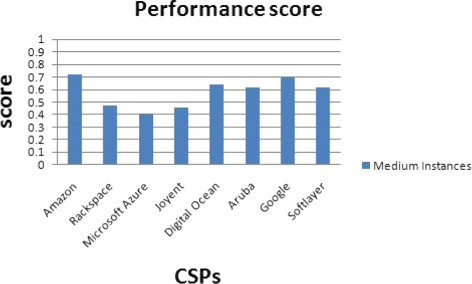
Performance score for medium instances
Fig. 42 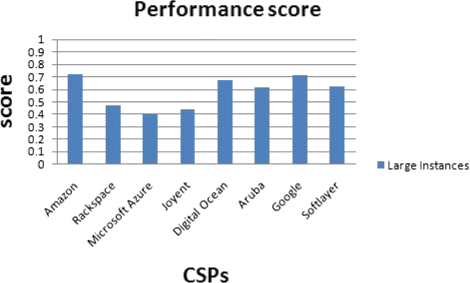
Performance score for large instances
Fig. 43 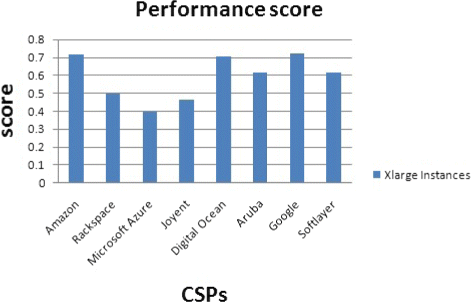
Performance score for xlarge instances


Also, in the case of Memory-intensive application with xlarge instance size, Google compute engine gets the highest performance score and Digital Ocean the second place (Fig. 43). But, Digital Ocean has the lowest price for xlarge instances.
As we can notice from the examples above, the best suitable CSP can change depending on the requirements of the customer. Our method will help the user select the best CSP. The new customer aware figure of merit helps the customer to choose the best CSP according to his requirements. The customer is implied in our method by defining his requirements from the proposed performance metrics and/or the price metric.
Conclusion
In the cloud computer market, each CSP has its own configurations and prices for the offered VMs. This causes a problem for the Cloud customers as there is no clear comparison between VMs. Thus, the choice of the most suitable CSP is not easy for the Cloud customers. Moreover, according to the VM performances, CSPs give general description of VMs’ performances without quantitative performance evaluation. These issues make the selection of the CSP harder for the Cloud customers.
In our paper, we build a roadmap towards a unified customer aware figure of merit for CSPs’ selection. To achieve our goal, we first start by benchmarking the performance of 8 of the major CSPs in the market to compare the performances across CSPs. We consider 4 VM sizes at each CSP. To evaluate the performance of one VM, we select 7 metrics and run tests to measure the performance of each metric apart. In a second step, we put all the measured values in one Radar figure giving a general overview of the performance of one instance size from the chosen CSPs. In a third step, we add the price metric to our performance view to come out with a value figure classifying the performance vs. price aspect to find which CSP offers the best value. This figure takes into account the technical aspect and the financial aspect of one CSP. In a last step, the customer choose the weights (importance) of each parameter according to his requirements. Thus, we achieve a unified figure of merit for CSPs’ selection. This unified figure of merit is customer aware as the customer is implied by setting his requirements and select the CSP that best fits the requirements.1
As a future work, more metrics can be added to our study in order to have a wider performance view of the VMs. On the other hand, our study can be used in the context of Federated Cloud as a decision criteria to better satisfy users need. One CSP’s client performance requirements that cannot be satisfied locally can be outsourced to other CSPs in the Federation. The application of our unified customer aware figure of merit help managing such context.
Endnote
1 The ranking of the quality of service provided by the various Cloud Service Providers mentioned in this paper must be considered as an indication. Thus, different benchmarks could have driven to relatively different results. In addition, our tests have been performed on specific data centers and within specific time periods that could also impact the obtained results.
Abbreviations
- CSP:
-
Cloud service provider
- VM:
-
Virtual machine
- MRT:
-
Mean response time
- RSD:
-
Relative standard deviation
- HPCC:
-
High performance computing cluster
- COSBench:
-
Cloud object storage benchmark
- vCPU:
-
Virtual CPU
- S:
-
Small
- M:
-
Medium
- L:
-
Large
- XL:
-
Xlarge
References
project IEasi Clouds. http://www.easi-clouds.eu/.
Li Z, OBrien L, Cai R, Zhang H (2012) Towards a taxonomy of performance evaluation of commercial cloud services. 2013 IEEE Sixth International Conference on Cloud Computing 0: 344–351. doi:http://dx.doi.org/10.1109/CLOUD.2012.74.
Salah K, Al-Saba M, Akhdhor M, Shaaban O, Buhari MI (2011) Performance evaluation of popular Cloud IaaS providers In: International Conference for Internet Technology and Secured Transactions (ICITST), 345–349. http://ieeexplore.ieee.org/stamp/stamp.jsp?tp=&arnumber=6148463&isnumber=6148349.
Iosup A, Ostermann S, Yigitbasi MN, Prodan R, Fahringer T, Epema DHJ (2011) Performance analysis of cloud computing services for many-tasks scientific computing. IEEE Trans Parallel Distrib Syst 22(6): 931–945. doi:http://dx.doi.org/10.1109/TPDS.2011.66.
He Q, Zhou S, Kobler B, Duffy TD ad McGlynn (2011) Performance analysis of cloud computing services for many-tasks scientific computing. IEEE Trans Parallel Distrib Syst 22(6): 931–945. doi:http://dx.doi.org/10.1109/TPDS.2011.66.
Moreno-Vozmediano R, Montero RS, Llorente IM (2011) Multicloud deployment of computing clusters for loosely coupled mtc applications. IEEE Trans Parallel Distrib Syst 22(6): 924–930. doi:http://dx.doi.org/10.1109/TPDS.2010.186.
Schad J, Dittrich J, Quiané-Ruiz JA (2010) Runtime measurements in the cloud: Observing, analyzing, and reducing variance. Proc VLDB Endow 3(1–2): 460–471.
Baun C, Kunze M (2010) Performance measurement of a private cloud in the opencirrus™ testbed In: Proceedings of the 2009 International Conference on Parallel Processing. Euro-Par’09, 434–443.. Springer, Berlin, Heidelberg. http://dl.acm.org/citation.cfm?id=1884795.1884845.
Alhamad M, Dillon T, Wu C, Chang E (2010) Response time for cloud computing providers In: Proceedings of the 12th International Conference on Information Integration and Web-based Applications & Services. iiWAS ’10, 603–606.. ACM, New York, NY, USA. doi:http://dx.doi.org/10.1145/1967486.1967579. http://doi.acm.org/10.1145/1967486.1967579.
Hill Z, Li J, Mao M, Ruiz-Alvarez A, Humphrey M (2010) Early observations on the performance of windows azure In: Proceedings of the 19th ACM International Symposium on High Performance Distributed Computing. HPDC ’10, 367–376.. ACM, New York, NY, USA. doi:http://dx.doi.org/10.1145/1851476.1851532 doi:http://dx.doi.org/10.1145/1851476.1851532.
Mao M, Humphrey M (2012) A performance study on the vm startup time in the cloud In: Cloud Computing (CLOUD), 2012 IEEE 5th International Conference On, 423–430. doi:http://dx.doi.org/10.1109/CLOUD.2012.103.
Li Z, O’Brien L, Zhang H, Cai R (2013) Boosting metrics for cloud services evaluation – the last mile of using benchmark suites In: 2013 IEEE 27th International Conference on Advanced Information Networking and Applications (AINA), 381–388. doi:http://dx.doi.org/10.1109/AINA.2013.99.
Iosup A, Ostermann S, Yigitbasi MN, Prodan R, Fahringer T, Epema DHJ (2011) Performance analysis of cloud computing services for many-tasks scientific computing. IEEE Trans Parallel Distrib Syst 22(6): 931–945. doi:http://dx.doi.org/10.1109/TPDS.2011.66.
Abramova V, Bernardino J, Furtado P (2014) Testing cloud benchmark scalability with cassandra In: Services (SERVICES), 2014 IEEE World Congress on, 434–441. doi:http://dx.doi.org/10.1109/SERVICES.2014.81.
Rak M, Aversano G (2012) Benchmarks in the cloud: The mosaic benchmarking framework In: Symbolic and Numeric Algorithms for Scientific Computing (SYNASC), 2012 14th International Symposium On, 415–422. doi:http://dx.doi.org/10.1109/SYNASC.2012.41.
Gomez Saez S, Andrikopoulos V, Leymann F, Strauch S (2014) Evaluating caching strategies for cloud data access using an enterprise service bus In: Cloud Engineering (IC2E), 2014 IEEE International Conference On, 289–294. doi:http://dx.doi.org/10.1109/IC2E.2014.49.
Zheng Q, Chen H, Wang Y, Duan J, Huang Z (2012) Cosbench: A benchmark tool for cloud object storage services In: Cloud Computing (CLOUD), 2012 IEEE 5th International Conference On, 998–999. doi:http://dx.doi.org/10.1109/CLOUD.2012.52.
Agarwal D, Prasad SK (2012) Azurebench: Benchmarking the storage services of the azure cloud platform In: Parallel and Distributed Processing Symposium Workshops PhD Forum (IPDPSW), 2012 IEEE 26th International, 1048–1057. doi:http://dx.doi.org/10.1109/IPDPSW.2012.128.
Cloud Harmony benchmark. https://cloudharmony.com/.
Server Bear Cloud benchmark. https://serverbear.com/benchmarks/cloud.
Cloud Spectator benchmark. https://cloudspectator.com/.
Pystone benchmark for CPU performance. https://ironpython.codeplex.com/wikipage?title=IP26RC1VsCPy26Perf.
Sysbench benchmark for CPU performance. http://wiki.gentoo.org/wiki/Sysbench.
Stream benchmark for memory performance. http://www.cs.virginia.edu/stream/ref.html.
Bonnie++ benchmark for disk I/O performance. http://www.textuality.com/bonnie/.
Stantchev V (2009) Performance evaluation of cloud computing offerings In: Advanced Engineering Computing and Applications in Sciences, 2009. ADVCOMP ’09. Third International Conference On, 187–192. doi:http://dx.doi.org/10.1109/ADVCOMP.2009.36.
Vöckler JS, Juve G, Deelman E, Rynge M, Berriman B (2011) Experiences using cloud computing for a scientific workflow application In: Proceedings of the 2Nd International Workshop on Scientific Cloud Computing. ScienceCloud ’11, 15–24.. ACM, New York, NY, USA. doi:http://dx.doi.org/10.1145/1996109.1996114. http://doi.acm.org/10.1145/1996109.1996114.
Yigitbasi N, Iosup A, Epema D, Ostermann S (2009) C-meter: A framework for performance analysis of computing clouds In: Cluster Computing and the Grid, 2009. CCGRID ’09. 9th IEEE/ACM International Symposium On, 472–477. doi:http://dx.doi.org/10.1109/CCGRID.2009.40.
Dejun J, Pierre G, Chi CH (2009) Ec2 performance analysis for resource provisioning of service-oriented applications In: Proceedings of the 2009 International Conference on Service-oriented Computing. ICSOC/ServiceWave’09, 197–207.. Springer, Berlin, Heidelberg. http://dl.acm.org/citation.cfm?id=1926618.1926641.
Lenk A, Menzel M, Lipsky J, Tai S, Offermann P (2011) What are you paying for? performance benchmarking for infrastructure-as-a-service offerings In: 2011 IEEE International Conference On Cloud Computing (CLOUD), 484–491. doi:http://dx.doi.org/10.1109/CLOUD.2011.80.
Phillips SC, Engen V, Papay J (2011) Snow white clouds and the seven dwarfs In: 2011 IEEE Third International Conference On Cloud Computing Technology and Science (CloudCom), 738–745. doi:http://dx.doi.org/10.1109/CloudCom.2011.114.
El-Khamra Y, Kim H, Jha S, Parashar M (2010) Exploring the performance fluctuations of hpc workloads on clouds In: Proceedings of the 2010 IEEE Second International Conference on Cloud Computing Technology and Science. CLOUDCOM ’10, 383–387.. IEEE Computer Society, Washington, DC, USA. doi:http://dx.doi.org/10.1109/CloudCom.2010.84. http://dx.doi.org/10.1109/CloudCom.2010.84.
Amazon elastic compute cloud (ec2). http://aws.amazon.com/ec2/.
Rackspace Cloud Services. http://www.rackspace.com/.
Azure: Microsoft’s Cloud Platform. http://azure.microsoft.com/en-us/.
Joyent Cloud Services. https://www.joyent.com/.
Digital Ocean Cloud Services. https://www.digitalocean.com/.
Aruba Cloud Services. http://www.arubacloud.fr/home.aspx.
Google Compute Engine (GCE). https://cloud.google.com/compute/.
Softlayer Cloud Services. https://www.softlayer.com/.
Acknowledgements
This work has been granted by the Easi-Clouds, a European ITEA 2 research project.
Author information
Authors and Affiliations
Corresponding author
Additional information
Competing interests
The authors declare that they have no competing interests.
Authors’ contributions
BZ provided the idea and the design of the study. BZ did the performance analysis, collected the data, and presented it in a clear way when writing the manuscript. MG participated in the design of the study, gives sufficient help in the presentation of the results, and helped to draft the manuscript. All authors read and approved the final manuscript.
Rights and permissions
Open Access This article is distributed under the terms of the Creative Commons Attribution 4.0 International License (http://creativecommons.org/licenses/by/4.0/), which permits unrestricted use, distribution, and reproduction in any medium, provided you give appropriate credit to the original author(s) and the source, provide a link to the Creative Commons license, and indicate if changes were made.
About this article

Cite this article
Zant, B.E., Gagnaire, M. Towards a unified customer aware figure of merit for CSP selection. J Cloud Comp 4, 24 (2015). https://doi.org/10.1186/s13677-015-0049-1
Received:
Accepted:
Published:
DOI: https://doi.org/10.1186/s13677-015-0049-1