- Research
- Open access
- Published:
Research on dynamic time warping multivariate time series similarity matching based on shape feature and inclination angle
Journal of Cloud Computing volume 5, Article number: 11 (2016)
Abstract
Different sets of research mainly focus on one variable time series now, while researches involving multivariate time series have been insufficient. In this paper, combined linear segments and fitting error for multivariate time series, we present a new method to reduce the time complexity of DTW distance metric algorithm. Based on the shape feature and the tilt angle, we propose a new approach for similarity matching of DTW multivariate time series. Experimental results demonstrate that this method is helpful for ensuring accuracy and for reducing the time complexity of similarity matching.
Introduction
Currently, time series are widely used in economics, management, computers, mathematics, electronics and many other interdisciplinary researches [1]. The study about time series has been developed rapidly since 1990. Time series similarity search is used to research clustering, classification, pattern matching, rule discovery, content anomaly detection and many other aspects etc. Time series similarity is a fundamental problem of time series data mining [2], and its research mainly covers: how to judge the similarity of different time series, how to measure the degree of similarity, and how to find the most-like time sequences.
Time series is a series of recorded values in chronological order. This kind of data is quite common in our life, such as transactions data in stock industry, the vehicles’ running state data produced during driving, statistics data of clicking times on webpages, the description data of human body posture matching the postural action, and measurement data of planetary motion trajectory in astronomy industry [1].
Time series analysis is mainly used to extract meaningful statistics and other characteristics of the data, or in other words, to extract the potentially useful information from time series [3]. For example, timing data of power system loading contains plentiful information about characteristics of the power load, and stock timing data contains laws of stock price fluctuation etc. Time series mining is of significant value. It can help people understand the information implied in time series and support people to make the right decision. However, current studies are mostly limited to one variable time series and the results sometimes may have deviation from the real situation. There are many studies on one variable time series, and mature theories and methods in this area have gradually formed. Multivariate time series are composed of several different data vectors [4], and its structure is more complex than one variable. Up to now, the theories and methods to study the multivariate time series are not well developed. However, the study of multivariate time series is more meaningful for many practical applications. For example, when we evaluate the weather conditions of a place, we need to considerate the temperature, pressure, humidity, and other factors to get more reliable results.
In recent years, with growth of massive information and data, more and more multivariate time series were produced. How to extract potential information from these multivariate time series has gradually attracted the attention of scholars. There are various variables in multivariate time series and they normally work together. If we only consider one variable at a time, we may loss valid information. In addition, for the same time period, multivariate time series data sets tend to occupy a larger space than one variable data set. Even after some dimension reduction process, they still take up very large storage space. Thus, data processing of multivariate time series needs an efficient data representation method. This method should focus on two aspects: pattern representation and similarity matching.
Related work
Pattern representation indicates some kind of changing features, which can summarize and represent the time series. Pattern representation may be the slope after time series is segmented, the mean or variance of the sampling points during a period of time, the symbol representation after discretization, or some function representation [5]. Compared with the original time series, the time series through pattern extraction can be manifested in a more concise form, which can effectively avoid the phenomena of “Curse of Dimensionality”. Currently, the typical pattern representation is Discrete Wavelet Transform (DWT) [6], Singular Value Decomposition (SVD) [7], Piecewise Aggregate Approximation (PAA) [8, 9], and Symbolic Aggregate Approximation (SAX) [10] etc. Among them, PAA can approximate the time series best, and it is simple, intuitive, and efficient [11]. Time series pattern representation is the basis of time series similarity matching research, while similarity matching is the core of their research. The similarity of two time series refers to: two time series are transformed, then calculated the values with similarity function, if the values satisfy stipulated error threshold, we think that the two time series under the condition of this kind of transformation are similar to each other. Although similarity matching has been studied as a key object, there still exist many unsolved difficult problems. For many current algorithms, the experimental results showed that they made a great improvement in operation efficiency. However, these improvements still have many limitations, if the parameters of the experiments are modified slightly, the results will be changed greatly. Currently, the common methods of multivariate time series similarity matching are Minkowski Distance [12], Dynamic Time Warping (DTW) distance [13, 14], Edit Distance [15–17], and Longest Common Subseries (LCS) etc. [17–19].
In similarity matching, DTW distance was first introduced by Berndt and Clifford to time series mining [20]. It could match the time series of equal or unequal length at the same time, support their stretching and bending on the time axis, and identify matching sequence effectively. In the traditional research, people usually changed multivariate time series into the one variable time series, and then calculated DTW distance of each variable directly and independently by making use of the methods achieved in the one variable time series studies. This had been used in many studies of multivariate time series. However, there are different relevant relationships among multivariate time series [21], which can provide more information for multivariate time series similarity matching and help us to improve the accuracy of similarity matching.
In [22], the authors use the Trend Distance (TD) approach based on DTW distance to measure time series. The method was proposed to fit time series by the first-order polynomial of Chebyshev and used TD method to measure the similarity simultaneously. A first order polynomial of Chebyshev is more suitable for one variable time series, but for multivariate time series, it is much more complex to fit. Moreover, since TD method selected different parameters, the accuracy rate is also quite different in their similarity. In view of this situation, we use a more simple method which combines PAA piecewise linear representation and fitting errors methods to extract pattern features (Piecewise Aggregate Approximation and Error, PAA_ERR), and then select the “tilt angle” and “shape feature value” of each segment which is produced by PAA_ERR method in a variable as the feature representation of the segment, finally, we propose a new similar measure method based on shape feature and inclination angle (Shape and Angle Dynamic Time Warping, SA_DTW) to measure the DTW distance between two time series to match their similarity.
Related concepts and theories
Definition 1 (time series) A time series, in a statistical perspective, refers to different samples values of certain index in the timeline. In a mathematics perspective, it is a series of record values by measuring a certain variable X (t) according to the time sequence. In a broad sense, it means the attribute values during a period of time. Similarly, multivariate time series means time series with multiple variables, based on the previous concept. For Multivariate time series X 1, X 2,…, X M , Where X i = (χ i,1, χ i,2, ⋯, χ i,N ), i = 1,2,…,N, especially if M = 1, the given series is a univariate time series (UTS) and if M > 1, it’s a multivariate time series(MTS).
We assume that there is a multivariate time series A which contains m variables, and the length of the time series is n, then it can be expressed as a matrix form of m × n:
Definition 2 (MTS’ piecewise line representation) Suppose that there is a multivariate time series A in formula 1, then its piecewise linear representation can be defined as follows:
Where Wij denotes the coordinate of two endpoints of the i-th variable from tk-1 to tk, the j-th segment. f i (t) denotes the Wij linear function linking the starting and ending point of the i-th variable from tk-1 to tk. e i (t) denotes the fitting error between the original time series and the new fitting segment from tk-1 to tk.
Definition 3 (the fitting error of MTS’ piecewise line representation), We assume that there is an MTS A in the formula (1) and let d1, d2,…, dj denotes the vertical distance from j observations in the original time series to fitting line segment. Then the fitting error of the segments for variable i can be represented by the following formula:
Where i = 1, 2, …, m, and it indicates a total of m variables. The calculation principle of fitting error is shown in Fig. 1.

Calculation principle of fitting error
Where | EF | is the length of the line fitting error of each segment. For a segment of all variables, the sum of the fitting error on all variables of multivariate time series is as follow: \( {\mathrm{e}}_{total} = {\displaystyle \sum_{i=1}^m{e}_i}, \) where e total denotes a total fitting error of all the variables in a segment.
Definition 4 (Dynamic time warping distance [23]) It is also called DTW distance. Assuming two time series A = (a1,a2,…,am),B = (b1,b2,…,bn), then the DTW distance formula of the two time series is as follows:
DTW algorithm is to use the classic dynamic programming to find an optimal path with a minimum cost of bending, and the time complexity is Ο(|A| ⋅ |B|). In brief, it is to find the shortest path by constructing an adjacency matrix. The cumulative distance calculated by DTW distance method is shown in Table 1:
In the above table, the DTW distance between time series A and B [1:i] (Ddtw(A,B[1:i])) is stored in the cell of the top of the i-th column in Table 1. Similarly, Ddtw (A [1: i], B) is stored in the cell of the right of the i-th row in Table 1. The same principle can be used to calculate multivariate time series, but in multivariate time series, ai, bj indicate the corresponding column vectors.
Multivariate time series model representation
From the TD method of Lee et al., we can see that when the weight values corresponding to the appropriate tilt angle and the time maintaining length were changed, the accuracy rate would be changed significantly. Particularly when the value of tilt angle was 0, the value of time maintaining length was 1, then the accuracy rate was only 0.27, which indicated the time maintaining length might not distinguish differences and similarities of the time series very well. Therefore, in order to reduce the time complexity, to make the measurement more accurate and to make the calculation more efficient, we combined PAA with fitting error to divide the multivariate time series into several segments. Then, on the basis of each tilt angle, we extracted the value of tilt angle and shape feature as pattern representations of the segments.
PAA method is a classic representation of time series, which is able to extract the relatively independent pattern based on morphological changes. The more segments, the higher segmentation accuracy will be. On the contrary, the less segments, the lower segmentation accuracy. In addition, PAA method is capable of data abstraction and noise filtering. Meanwhile, after the combination of PAA and fitting error, it can further screen segments of larger deviation, getting more detailed segmentation. And more importantly, fitting error can combine all the variables of time series, considering the overall situation, which can effectively prevent the loss of information, and further filter noise data.
PAA_ERR: the segmentation method to multivariate time series
When we use the PAA_ERR method on the multivariate time series, we take all the variables as a whole into consideration, that is, we use PAA to divide all variables into segments, if the value of overall fitting error e total of a segment is greater than the threshold value on all the variables, then reprocess the segment, until the e total is less than threshold value.
The steps of this algorithm are as follows:

Assume that time series MTS processed by PAA_ERR can be divided into s segments, then the linear representation of these multivariate time series after processing can be denoted as L(MTS) = {L(xi1, xi2), L(xi2, xi3), …, L(xik- 1,xik),i∈[1,m],k∈[1,s]}, where i represents a variable of the segmentation, where xik represents the record value of the time series, L(xik- 1,xik) represents a straight line connecting two points.
The shape feature representation of multivariate time series
In similarity query process, there are two situations needed to be carefully considered: the first is that if there exist “zooming in” or “zooming out” modes similar to the given mode when checking the time series, namely, similar to “zooming in” or “zooming out” mode, then it is an approximate proportional scaling of the length and magnitude to the given mode. For instance, the trend of the stock price change with different time durations could be similar, but this cannot be found with the general equal length pattern queries method. Another case is that in an enlarged similar model, there are some small “vibrating” intervals, and they do not affect the overall trends. In this case, we should focus on the main trend and ignore these small intervals.
An important feature of time series is the changes of growing or declining sequence rate. If the growth or decline rate becomes bigger, it indicates the sequence morphological changes tend to increase; if the growth rate becomes smaller, it indicates that the sequence curves tend to be flat and its morphological changes start to decrease. Hence, these turning points can be found through the changes of line segment slopes.
In the [24] literature, according to the changes of slope, the authors described the shape characteristics of time series as a collection of seven variables {declining rapidly, keeping down, declining slowly, horizontal, rising slowly, keeping rising, rising rapidly}, and they were denoted as M = {-3, -2, -1, 0, 1, 2, 3} corresponding to the above-described mode. The specific numbers was shown in Table 2. This method could reflect the degree of dynamic changing trends. However, in literature [23], the authors used the time series which was completely represented by this model, and this method led to the problem that time series was not sensitive to its stretching. It can be seen clearly in Fig. 2, where the representation modes of these two time series would be identical (calculated by Table 2).

Two identical time series forms
Based on the above cases, this paper combined the representation method of “shape mode” with the tilt angle of time-series. Meanwhile, we extracted various segments of its tilt angle and the shape mode as the segment feature representation from time series which was calculated by PAA_ERR calculation method. The inclination angle had a clear physical meaning, which could reflect the local changing trend of time series, and it reduced much calculation. The value of shape mode could show the trends of time series during a period of time. The combination of “shape mode” and the tilt angle reflected the extent of dynamic changing trends more effectively.
We assume that A [m × n] is a multivariate time series of m-variable n-sections after being segmented, the deformation intensity of each segment is denoted as Ti (i = 1, 2,…,n), Ti = max(yi) - min(yi) representing the different value between the maximum sample value of each segment and the minimum sample value. \( {\displaystyle \sum_{j=1}^n{T}_j} \) represents the sum of all deformation strength in a variable. Then, the weight of each shape mode segment can be represented by the following formula:
The steps of this algorithm are as follows:
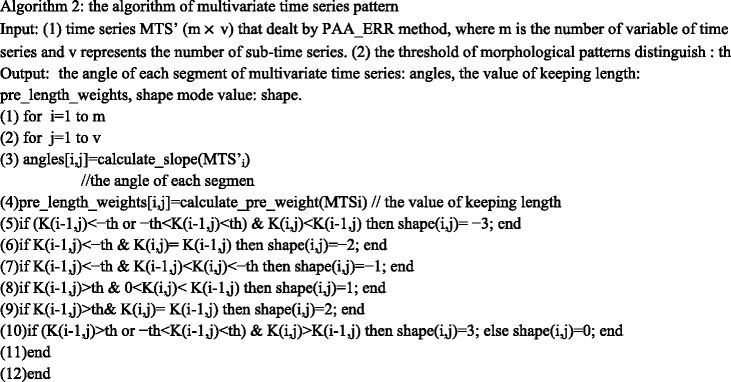
Where K (i, j) represents the slope of the j-th variable of the i-th segment.
Then multivariate time-series Am*n can be denoted as:
Which α represents the inclination angle of each segment, ℑ is the weight of segmented form, p is the value of segmented shape pattern. And in each variable, the sum weight of the shape characteristics is 1.
The similarity matching of SA_DTW method
Suppose the shape characteristics representation of two time series A, A ` can be expressed as follows:
Where ai, ai ` (i = 1, 2, …, n) are the column vector of the two time series A, A `. From definition 4, the shape characteristics distance of A, A ` is defined as follows:
And the base distance is defined as follows:
Where, q takes 10 % of the time series’ length. In the k-th variable, λ k , β k indicate difference between shape mode and the tilt angle weight values, and
Result and analysis
The experiments were performed on Intel (R) Core (TM) i7 CPU, with 2.98 GB memory. The operation system is Windows 7 Ultimate, and the software was MATLAB7.11.0. We tested our implementation with two data sets from http://kdd.ics.uci.edu/databases/: Vicon Physical Action Data Set (VPA) and EEG. The VPA data set was collected from seven male and three female, which reflected human action in both normal conditions and violent scenes; while the EEG data set came from the populations of two distinct: Alcoholic Subjects and Control Subjects. This paper contained two experiments: PAA_ERR and SA_DTW. The PAA_ERR method divided the multivariate time series into several segments, taking compression ratio of multivariate time-series as the main indicator to compare, while SA_DTW method compared time complexity and accuracy of similarity in the algorithm.
PAA_ERR method
For the above two data sets, PAA_ERR algorithm could maintain the original features of multivariate time series and greatly reduced the amount of data. For example, Fig. 3 showed the waveform of the Headering data by using PAA_ERR algorithm. Since PAA_ERR is based on PAA algorithm, for the compression algorithm of time series, we chose PAA algorithm as control.

The three-variable data of headering’s fitting renderings
In Table 3, initSegNum represented the number of initial segments after PAA_ERR algorithm, and finalSegNum indicated the number of final segments. PAA_ERR used the initial segmentation generated by using PAA, and then, further processed the time series by using fitting error. Therefore, in Table 3, the initSegNum’ value and finalSegNum’ value for the PAA were always equal. The maxSegErr represented the largest fitting error after the segmentation. According to previous algorithm, we knew that fitting error of each segment divided from PAA_ERR algorithm was smaller than the threshold; hence the maxSegErr value was basically equal. The timeSeqErr represented the overall fitting error value of the time series which is the sum of all fitting error value of all segments and variables. Compression ratio is the ratio of the number of time series segments calculated by PAA_ERR algorithm to the length of the original time series.
-
(1)
As can be seen from the above table, multivariate time series calculated by PAA_ERR algorithm could guarantee that every fitting error was far smaller than the PAA algorithm, and the overall fitting error of the time series was also significantly smaller than the PAA direct segments. More importantly, the PAA_ERR algorithm could guarantee small fitting error. It also enabled time series compression rate to reach 90 % and above. So it indicated that PAA_ERR algorithm in multivariate time series piecewise linear representation could get better results by reducing the fitting error.
-
(2)
Figure 3 showed the direct effect from PAA_ERR calculation for the first three-variable data of Headering data when the fitting error threshold was 0.01.
The horizontal axis was a time axis, and the vertical axis was the recorded values after standardization. Blue lines were the original time series and the red ones were the time series after processing algorithms.
Through the above experiment, when the error threshold was set to 0.05, the compression ratio of the original time series could reach 90 %, and the algorithm could effectively preserve the local characteristics and the overall shape trends of the original sequence under the premise of ensuring high compression ratio.
PAA_ERR method used the overall fitting error for the final segment. For those time series of small time span but large sequence trend changes, time segment calculated by PAA_ERR would get very close to the original sequence, and resulted in poor final segment results. Therefore, in the next experiment, we also used a time series with smaller trend change sequence as a test object.
SA_DTW method
In the experiment, we adopted multivariate time series, Australian Sign Language signs (High Quality) dataset provided by UCI public databases. It used a total of 22 attributes to depict the bending degrees of every finger in right and left hand. And the two hands were depicted with 11 attributes respectively, in which six attributes described the information of hand position and the other five variables used to describe the bending degrees of the thumb, forefinger, middle finger, ring finger and the little finger. The data set contained 95 categories (a category represented a gesture), each category had 27 groups of data, and the sampling rate was 0.01 s, namely each frame data was collected by every 0.01 s. In order to facilitate the comparison of our experiment, we used the TD method, which was also adopted by Li Zhengxin and others in their experiment, as the object of experimental comparison. The entire experiment could be divided into two steps. Step 1: to choose one sequence randomly from the experiment data set as an input instance. Step 2: for the chosen one and remaining sequences, using TD method and SA_DTW method to implement the distance calculation. Then, select the closest one, five, or ten sequences, record the sequence numbers different from the input instance of different categories, and then use the 4 to 7 formula to calculate its accuracy. Repeating the experiment was repeated for 50 times to calculate its accuracy.
As was shown in Figs. 4, 5 and 6, when the weight of slope angle was changed, the accuracy of TD method and SA_DTW method would be also changed. In the diagram, when the slope angle weight value was 0, the weight of TD method’s time span and SA_DTW’s shape mode value were 1 respectively, the accuracy of TD method decreased to 20 %, while SA_DTW still had high accuracy. It indicated that the shape weight we proposed in this paper was more suitable for the representation of multivariate time series model. It also can be seen through Table 4 that SA_DTW method is better than TD methods on reducing the time complexity.

Result of 1-NN query

Result of 5-NN query

Result of 10-NN query
Conclusion
This paper presented a new method of similarity search: SA_DTW. It adopted shape mode and tilt angle to represent the feature of each segment. SA_DTW carried out a whole segment on all variables, and reflected the correlation among various variables to some extent. In addition, it supported time series’ stretching and bending on the time line. Through the experiments we could see SA_DTW could effectively reduce the time complexity compared with the DTW method. The method that combined shape feature and tilt angle could greatly improve the accuracy of similarity matching.
References
Qian-yun MO, Cheng Z (2008) Parallel computing dynamic warping distances for time sequences on the cluster computing systems. Microelectron Comput 25:155–158
Khan Z, Anjum A, Soomro K, Tahir MA (2015) Towards cloud based big data analytics for smart future cities. J Cloud Comput 4(1):1
Prema V, Uma Rao K (2015) Time series decomposition model for accurate wind speed forecast. Renewables Wind Water Solar 2–18:2015
Hai-lin LI (2015) Feature representation of multivariate time series based on correlation among variables. Control Decis 30:441–446
Yan-yan Z, Rong-cong X, Xiao-yun C (2006) Time series piecewise linear representation based on slope extract edge point. Comput Sci 33:139–142
Chan K, Fu AW (1999) Efficient time series matching by wavelets. In: Richard ST (ed) Proceedings of 15th IEEE International Conference on Data Engineering (ICDE). IEEE Computer Society, Sydney, pp 126–133
Korn F, Jagadish H, Faloutsos C (1997) Efficiently supporting ad hoc queries in large datasets of time sequences. In: Joan P (ed) Proceedings of ACM SIGMOD international conference on management of data. Morgan Kaufmann Publisher, Tuescon, pp 289–300
Keogh E, Pazzani M (2000) A simple dimensionality reduction technique for fast similarity search in large time series databases. In: Terano T, Liu H, Chen AL (eds) Proceedings of 4th Pacific-Asia conference on knowledge discovery and data mining. Springer-Verlag, Kyoto, pp 122–133
Yi B, Faloutsos C (2000) Fast time sequence indexing for arbitrary Lp norms. In: Abbadi AE, Brodie ML, Chakravarthy S et al (eds) Proceedings of the 26th International Conference on Very Large Databases (VLDB). Morgan Kaufmann Publishers, Cairo, pp 385–394
Lin J, Keogh E, Londardi S et al (2003) A symbolic representation of time series, with implications for streaming algorithms. In: Mohammed JZ, Charueds AC (eds) Proceedings of the 8th ACM SIGMOD workshop on research (DMKD). ACM Press, San Diego, pp 55–68
Bin M, Jin-lai Y (2009) Efficient time series lower bounding technique. Comput Eng Appl 45(11):168–171
Agrawal R, Faloutsos C, Swami A (1993) Efficient similarity search in sequence databases. //Proc of the 4th International Conference on Foundations of Data Organization and Algorithms. Chicago, p 69-84.
Keogh E (2005) Exact indexing of dynamic time warping[J]. Knowl Inf Syst 7(3):358–386
Yi B, Jagadish H, Faloutsos C (1998) Efficient retrieval of similar time sequences under time warping. In: Sipple RS (ed) Proceedings of International Conference of Data Engineering (ICDE). IEEE Computer Society, Orlando, pp 201–208
Ristad ES, Yianilos PN (1997) Learning string edit distance. In: Douglas FH (ed) Proceedings of 14th International Conference on Machine Learning (ICML). Morgan Kaufmann Press, Nashville, pp 287–295
Chen L, Ng R (2004) On the marriage of Lp-norm and edit distance. In: Nascimento MA, Zsu MT, Kossmann D et al (eds) Proceedings of 30th International Conference on Very Large Databases (VLDB). Morgan Kaufmann Publishers, Toronto, pp 792–801
Das G, Gunopulos D, Mannila H (1997) Finding similar time series. In: Komorowski J, Zytkow J (eds) Proceeding of 1st European Symposium on Principles of Data Mining and Knowledge Discovery (PKDD). Springer-Verlag, Bergen, pp 88–100
Vlachos M, Kollios G, Gunopulos D (2002) Discovering similar multidimensional trajectories. In: Agrawal R, Dittrich K, Ngu AH (eds) Proceedings of 18thInternational Conference on Data Engineering (ICDE). IEEE Computer Society, San Jose, pp 673–684
Vlachos M, Hadjieleftheriou M, Gunopulos D et al (2003) Indexing multi-dimensional time-series with support for multiple distance measures. In: Getoor L, Senator TE (eds) Proceedings of ACM SIGKDD International Conference on knowledge discovery and data mining. ACM Press, Washington DC, pp 216–225
Berndt DJ, Clifford J (1994) Using dynamic time warping to find patterns in time series. Working Notes of the Knowledge Discovery in Databases Workshop, Seatle
Zhen-xing W, Lai-wan C (2012) Learning causal relations in multivariate time series data[J]. ACM Trans Int Syst Technol 3(4):71–76
Zheng-xin L, Feng-ming Z, Ke-wu L (2011) DTW based pattern matching method for multivariate time series. Pattern Recognit Artif Intell 24(3):425–430
Hui X, Yun-fa H (2005) Data mining based on segmented time warping distance in time series database. J Comput Res Dev 42(1):72–78
Xiao-li D, Cheng-kui G, Zheng-ou W (2007) Research on shape-based time series similarity matching. J Electron Inf Technol 29(5):1228–1231
Acknowledgments
This paper is supported by Beijing Natural Science Foundation (NO.4144073), supported by Research Fund of North China University of Technology, supported by National Natural Science Foundation of China (NO. 41471303), supported by training project for outstanding young teachers of North China University of Technology.
Authors’ contributions
DC provided the idea of the paper, carefully designed the algorithm in the manuscript, reviewed and edited the manuscript. JL performed the experiments and presented performance analysis. Both authors read and approved the final manuscript.
Competing interests
The authors declare that they have no competing interests.
Author information
Authors and Affiliations
Corresponding author
Rights and permissions
Open Access This article is distributed under the terms of the Creative Commons Attribution 4.0 International License (http://creativecommons.org/licenses/by/4.0/), which permits unrestricted use, distribution, and reproduction in any medium, provided you give appropriate credit to the original author(s) and the source, provide a link to the Creative Commons license, and indicate if changes were made.
About this article

Cite this article
Cao, D., Liu, J. Research on dynamic time warping multivariate time series similarity matching based on shape feature and inclination angle. J Cloud Comp 5, 11 (2016). https://doi.org/10.1186/s13677-016-0062-z
Received:
Accepted:
Published:
DOI: https://doi.org/10.1186/s13677-016-0062-z