- Research
- Open access
- Published:
Dual-channel convolutional neural network for power edge image recognition
Journal of Cloud Computing volume 10, Article number: 18 (2021)
Abstract
In view of the low accuracy and poor processing capacity of traditional power equipment image recognition methods, this paper proposes a power equipment image recognition method based on a dual-channel convolutional neural network (DC-CNN) model and random forest (RF) classification. In the aspect of feature extraction, the DC-CNN model extracts the characteristics of power equipment through two independent CNN models. In the aspect of the recognition algorithm, by referring to the advantages of the traditional machine learning method and incorporating the advantages of the RF, an RF classification method incorporating deep learning is proposed. Finally, the proposed DC-CNN model and RF classification method are used to classify images of various types of power equipment. The results show that the proposed methods can be effectively applied to the image recognition of various types of power equipment, and they greatly improve the recognition rate of power equipment images.
Introduction
The object recognition technology—which refers to the use of computers to extract features and realize analysis, description, and recognition of images [1–5]—has been widely used in various fields. In new smart substations and retrofitted unattended substations of power systems, some smart-monitoring technologies like helicopters, drones, robots, etc., equipped with cameras, take high-definition videos and infrared thermal images, to achieve efficient and rapid substation inspection. These massive media data streams provide a database for the image-based methods for power equipment state recognition. However, due to the particularity of the power equipment itself and the operating environment, it is not reasonable to use the object recognition in computer vision field to power equipment directly. In this way, it is of great significance to propose a method applicable to power edge image recognition.
There are now mainly two kinds of object recognition in power systems: manual feature extraction-based method and automatic feature extraction-based method.
Ref. [6] used the wavelet bases to detect the multi-scale edge of icing images and the Hough transform to calculate the icing thickness on transmission lines. Ref. [7–9] proposed a dynamic adaptive genetic algorithm to optimize the parameters of fuzzy method and carried out the thermal anomaly location and fault diagnosis of power equipment. Ref. [10–13] extracted thermal infrared image feature vectors, and used them to train a back-propagation (BP) neural network for classification and recognition of the images. Ref. [14–18] performed the target segmentation and feature extraction of inspection images by a marker-based watershed approach, and the final target recognition was completed based on the Hsim function. These traditional image processing algorithms are strongly dependent on feature extraction, the recognition performs well in experimental environment, but when applied to images from equipment in real power systems, there are many problems occurring such as difficulty in feature extraction and poor generalization ability, which makes them not applicable in actual production operation and maintenance. Besides, because of the time-consuming, labor-intensive, and low accuracy characteristics, traditional manual inspection methods are difficult to meet the needs of equipment state recognition.
Based on deep learning, automatic feature extraction-based method can effectively reduce the deviation of the model, and has higher accuracy because of the large volume of data used and deep feature extraction. Based on the infrared images, a two stage method for current transformer fault location is proposed in [19], which verified the fault area using superpixel segmentation and HSV in the first stage, and classified the fault location through the deep convolutional network in the second stage. To deal with the problems of bad weather, poor light, camera aging and angle issues, Ref. [20] proposed an India buffet process-convolutional neural network, IBP-CNN method for ice thickness classification, which makes the ice thickness recognition more generalized. To solve the problem of heavy calculation burden of the deep learning for image recognition, [21, 22] focused on the calculation reduction, which always speed up the recognition process with the cost of accuracy. To conclude, these studies show that as an end-to-end machine learning system, CNN can directly act on original data and automatically carry out feature learning, layer by layer. Compared with the manual features, the features obtained by CNN are more abstract and more expressive. However, most of the researches just focused on two kinds of power equipment, such as power transmission lines and insulators, in which experimental environment is mostly simple, and the complicated environment in practical applications is not fully considered.
Due to the shortcomings of the traditional recognition methods and the inapplicability of the deep learning method in power system problems, this paper proposes a dual-channel convolutional neural network for power edge image recognition, the main contributions of this paper are summarized as follows.
-
This paper proposes a dual-channel CNN (DC-CNN) model to extract the characteristics of power equipment through two independent CNN models.
-
This paper proposes a random forest(RF) classification method incorporating deep learning for defect recognition of power equipment
-
The proposed DC-CNN and RF classification method is used to classify images of various types of power equipment, and the validity of the proposed method is verified.
The rest of this paper is organized as follows. In “Feature extraction algorithm” section, we introduce the feature extraction algorithm. In “The extraction of substation features” section, we provide the method. In “Image recognition of power equipment” section, we discuss the power equipment image recognition method and present a case study. “Conclusion” section concludes the paper.
Feature extraction algorithm
AlexNet model
Extracting image features is the key step in image recognition. When the image background is simple and the power equipment features are prominent, the feature extract methods based on traditional image processing can obtain the ideal recognition accuracy, because of the easily recognized color features and shape features. However, due to the limitations of the installation location of the equipment, it is difficult to get the ideal image, for example, the image quality can be deteriorated when shooting angles were inappropriate and the light were weak.
AlexNet is a typical CNN designed by Alex Krizhevsky in 2012, which can be regarded as a feature engine [23–25]. There are 8 layers in the AlexNet model, among which the AlexNet model design has the following characteristics: 1) using the nonlinear activation function ReLU, 2) using the Dropout method to prevent overfitting, and using Data augmentation to complete the data expansion, 3) successfully applying the multi-GPU and LRN normalization layerin the model. The architecture of AlexNet Model is shown in Fig. 1. [26].

The architecture of AlexNet Model
convolution layer can well describe the local features of the image. The penultimate layer and the antepenultimate layer are full connection layers, which can well describe the global features of the images.
The process of the AlexNet model can be described as follows: take a sample (X,Xp), where X is the input image, Xp is the category of X, and the output is calculated by
Where W(n) (n=1,2…,8) is the weight, B(n) (n=1,2…,8) is the bias, Fn (n=1,2…,8) is the calculations of each layer, and n is the number of layers of the AlexNet model.
DC-CNN model
To improve the recognition accuracy of the AlexNet model, reduce the training time of model, and extract the features of the different characteristics of the equipment, this paper makes an extension and modification based on the AlexNet network structure by proposing a DC-CNN model. The model uses two independent CNN models to get the two sets of device characteristics. After the two sets of characteristics are subjected to cross-mixing at the top, the final image characteristics of the equipment are output.
DC-CNN carries out two cross-mixings on two sets of characteristics. First, the outputs of the two full connection layers are cross-connected and used as the input of the next full connection layer. Then, the next full connection layer is split into two parts, the data in these two parts are mixed and connected, and the obtained feature vectors are the final features of the images. The designed DC-CNN model of the 11-layer deep convolutional neural network (DCNN) is shown in Fig. 2.

The architecture of DCNN
To ensure that the features extracted by the two CNNs are different and to increase the robustness of the features, the input images are transformed appropriately to make CNNa and CNNb have different inputs. The details are as follows. (1) The input of CNNa is the image whose size is 256 ×256 after the normalization processing of the original image, and (2) the input of CNNb is the V channel component extracted after the hue-saturation-value (HSV) transformation of the original image. CNNa and CNNb have the same structure and are both 9-layer neural networks, including 5 convolutional layers and 4 full-connection layers.
At the 10th layer, the DC-CNN first cross-connects the outputs of the 9th layer of CNNa and the 9th layer of CNNb as the input of the 11th layer, and the crossed results are divided into two parts at the 10th layer. The number of neurons in each part is 512. Then, in the 11th layer, the CNN features extracted from the two transform streams are mixed again to obtain a 256-dimensional feature vector, which is the final eigenvalue of the image obtained by the DC-CNN.
The extraction of substation features
According to the DC-CNN model described in this paper, the steps of the power equipment feature extraction can be obtained, and the flow chart of feature extraction is shown in Fig. 3.
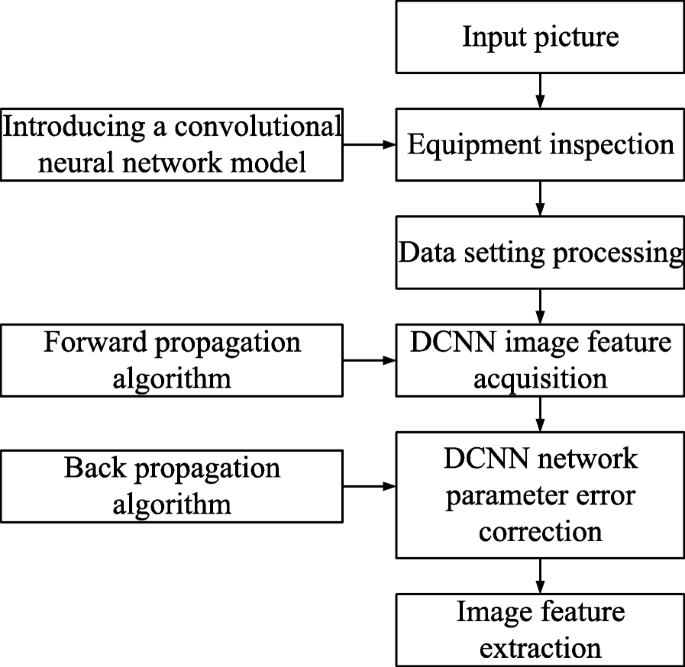
Flow chart of electric equipment characteristics extraction
The power equipment identification process consists of two parts: the training phase and the test phase. In the training phase, the image is randomly selected from the power equipment image dataset, and the deep features of the image are extracted based on the AlexNet model. Then, the extracted features are analyzed, and the appropriate feature subset is selected as the final feature vector. In the test phase, the AlexNet model is used to extract the features of the test image, select the subset of features selected in the training phase to represent the image features, and finally use the trained random forest to classify the test images.
For the DC-CNN model, the forward projection (FP) algorithm obtains image features through multiple convolution operations and down-sampling operations during its training. BP corrects the network parameters according to the known image information.
FP algorithm
Let XL be the output of the last layer, where L is the total number of layers in the network model. And the output of FP can be expressed as:
Where wL represents the weight matrix and gL represents the activation function.
At the top layer of the network, the logarithmic loss error function is used to calculate the difference between the output result and the actual result, and then the loss function can be expressed as:
Where xi is the input value, n is the number of images in the test set, yi is the category of xi and λ is the regularization coefficient of L2.
BP algorithm
BP algorithm uses the total loss function between the output result and the actual result to optimize the convolution kernel parameters in the network model. The objective function of the CNN for optimization is:
The BP algorithm uses Formula (5) to update the value of wL:
In the process of obtaining the optimal solution of the objective function, the error between the output value and the actual value of the model can reach the convergence state through the iterative operation of Formula (5).
The weights of the two cross-mixing layers of the DC-CNN are updated using Formula (6):
In Formula (6), gA and gB respectively represent the transformation functions of the exchange flow A and exchange flow B, and wA and wB, respectively, represent the weight matrixes of the exchange flow A and exchange flow B.
Image recognition of power equipment
The complex environment of power equipment leads to a complex image background. The logistic classifier and softmax classifier are able to solve the problem of multi-classification, but for more complicated and easily confused objects, the classification accuracy is not high [27]. In view of this, this paper combines deep learning with traditional machine learning theory, which adopts the RF classification method and deep learning [28–30] subsequently. The decision “forest” is composed of several decision trees generated by randomly selected sample subsets and feature subspaces, and then the classification results are output by voting in the classification stage.
The RF classification method consists of a training stage and a testing stage. In the training stage, first, in the equipment image database, the DC-CNN model proposed in 1.2 is used to randomly select images from the database and extract image features. Then, the learned features are analyzed based on the adaptability of the RF classification, and the features are selected based on the analysis results.
In the testing stage, the DC-CNN is used to extract the features of the test images, and the feature dimensions selected in the training stage are used to represent the image features. Finally, the trained RF is used to classify the test images.
Analysis of experimental results of feature extraction
In this paper, we tested five types of electrical equipment in a power transmission line, including insulators, transmission line towers, bird’s nest, large size fittings. The image database used for the testing, PowerImage, is a database of power system equipment collected by our laboratory that contains more than 30,000 images. The size range of the images is from 256 ×256 to 1024 ×1024, and the set mainly includes 20 types of power equipment, such as transformers, insulators, circuit breakers, power lines, and line towers. On average, there are approximately 1,000 images of each type. Figures 4 and 5 show some power equipment images with defections.

Two original images for feature test

The insulator image of tower
Figure 6 show the results obtained through the feature extraction of the original test images using the DC-CNN model.

The original image of insulator and its feature maps
Compared with the manually extracted color features, shape features and texture features, the features extracted by the DC-CNN are more abstract and can better reflect the essential features of the images.
Analysis of experimental results of substation image recognition
In order to test the validity of the features extracted by the DC-CNN proposed in this paper, the results of the feature extraction using the single CNN and DC-CNN are classified and compared. In the test, the numbers of images of insulators, transformers, breakers, transmission line poles and towers are 3000, 2000, 2000, 3000 and 500, respectively. Among them, 2000 insulator images, 1500 transformer images, 2000 circuit breaker images, 1000 transmission line pole images and 300 tower images were selected as training samples, and the rest were taken as test samples.
Figures 7 and 8 are the misclassification rate curves obtained during the training of the single CNN and DC-CNN, respectively.

The training process for single CNN

The training process for DCNN
Through the analysis of Fig. 7, it can be found that during the training stage, when the number of iterations is 61, the single CNN classification error rate reaches its minimum value, which is 9.0%. If the iterative operation continues, the misclassification rate of the single CNN is reduced to some extent. However, 2 iterative operations later, namely, on the 63 rd iteration operation, the misclassification rate increases again and hardly fluctuates thereafter.
Through the analysis of Fig. 8, it can be found that during the training stage, when the number of iterations is 53, the classification error rate of the DC-CNN reaches its minimum value, which is 5.5%. If the iterative operation continues, the classification error rate is reduced to some extent. However, after more 5 iterations, namely, on the 58th iteration, the classification error rate increases again and hardly fluctuates thereafter.
Using a single CNN and DC-CNN to recognize the five devices in the training data, validation data and test data, the obtained classification accuracies are shown in Table 1, and the average accuracy and average time are shown in Table 2.
Through the analysis of Tables 1 and 2, it can be seen that (1) after using two deep learning models, a single CNN and DC-CNN, to classify equipment images, the average accuracy is over 85%, which fully shows that the features extracted by the CNN have a high abstraction degree and strong expression capability. The device image recognition can achieve a high level of accuracy. (2) Compared with the DC-CNN, the recognition rate of the single CNN is reduced by 4.4%. The main reason is that the width of the DC-CNN model is wider compared to that of the single CNN, and it can thus extract richer image characteristics. However, in depth, the increase in the DC-CNN is not significant, and therefore, the complexity of the GPU running time for the DC-CNN does not increase much compared to that of the single CNN, just 0.3 s. (3) For the five types of equipment, namely, insulators, transformers, circuit breakers, power line poles and transmission line towers, the tower has the lowest recognition rate. The main reason lies in the small size of the tower image dataset, only 500 images, while the other types of equipment have datasets of 2000 or more images. A large quantity of training samples is preferred because it improves the generalization ability of the CNN modelling, reduces the risk of overfitting and achieves high accuracy. (4) The running time of the deep learning algorithm on the CPU is much higher than that on the GPU, which indicates that the deep learning algorithm is a time-consuming process. Therefore, in practical applications, if a deep learning method is needed, GPU support is required.
Results analysis of different recognition methods
To test the effectiveness of the proposed RF tree methods, this paper compares three recognition methods, namely, CNN + Softmax classifier (method 1), CNN + RF tree classifier (method 2), and traditional manual parameter extraction + RF tree classifier (method 3), on the power equipment image recognition. The recognition results of these methods are compared and shown in Table 3. In that table, type A represents the training recognition rate, and type B represents the testing recognition rate.
According to Table 3, it can be seen that (1) using methods 1 and 2 to classify equipment images, the average accuracy can reach over 80%, which indicates that the image features extracted by the CNN has a high abstraction degree and a strong expression ability and can obtain a high accuracy on the power equipment image recognition. (2) The accuracy of method 1 is 8.4% lower than that of method 2. This is because softmax’s directly use the deep characteristics of the last mixed full connection layer for classification processing, but the most effective characteristics of the different types of equipment are not the same. Thus, the effective selection of the characteristics of the DCNN can potentially improve the classification performance. (3) Compared with method 1 and method 2, method 3 has the lowest average recognition rate, which is only 75.2%. This is because method 3 uses manual features, such as the color, texture, and direction, to perform the classification and recognition. These factors cannot fully describe the essential characteristics of the equipment. The performance of the deep learning approach for feature extraction is better than that of the traditional feature extraction method, and thus, the final recognition rate of the deep learning approach is far higher than that of the traditional method. (4) For four types of power equipment, namely, insulators, transformers, circuit breakers, and transmission line poles, methods 1 and 2 have a recognition rate of over 85%. However, both recognition rates for the transmission line towers are lower than that of method 3. The main reason lies in the small size of the tower image dataset, only 500 images. Under the small sample condition, the performance of deep learning cannot exceed that of the traditional feature extraction method. This further indicates that the deep learning algorithm has a higher requirement for training samples, but when enough training samples are provided, the high accuracy of the deep learning algorithm could greatly improve the recognition accuracy.
Conclusion
In view of the low accuracy and poor processing capacity of the traditional power equipment recognition methods, this paper proposes a power equipment image recognition method based on the DC-CNN model. Through the image recognition of the various types of power equipment, the conclusions are as follows:
-
1
The proposed method in this paper can be effectively applied to the image recognition of various types of power equipment, and the obtained accuracy is high;
-
2
The image features extracted by the CNN have a high abstraction degree and strong expression ability. Compared with the single CNN, the DC-CNN can obtain richer image features.
-
3
Compared with the other methods, the accuracy of the image recognition by the DC-CNN classifier is higher.
Availability of data and materials
The data used to support the findings of this study are available from the corresponding author upon request.
References
Zhao S, Zhu J, Wu C, Wang B, He M (2018) A correction testing method for mechanical characteristic parameter of circuit breaker based on vision technology. IEEJ Trans Electr Electron Eng 13(8):1087–1091.
Wang B, Wan S, Zhang X, Choo K-KR (2018) A novel index for assessing the robustness of integrated electrical network and a natural gas network. IEEE Access 6:40400–40410.
Bi F, Zhu B, Gao L, Bian M (2012) A visual search inspired computational model for ship detection in optical satellite images. IEEE Geosci Remote Sens Lett 9(4):749–753.
Din FU, Ahmad A, Ullah H, Khan A, Umer T, Wan S (2019) Efficient sizing and placement of distributed generators in cyber-physical power systems. J Syst Architect 97:197–207.
Wang J, Luo J, Liu X, Li Y, Liu S, Zhu R, Anjum A (2019) Improved Kalman filter based differentially private streaming data release in cognitive computing. Futur Gener Comput Syst 98:541–549.
Tong W-G, Li B-S, Yuan J-S, Zhao S-T (2009) Transmission line extraction and recognition from natural complex background In: 2009 International Conference on Machine Learning and Cybernetics. Vol. 4, 2473–2477.. IEEE, Baoding.
Haoyang C, Yongpeng X, Yue S, et al (2015) Substation infrared image fuzzy enhancement algorithms based on improved adaptive genetic theory. High Voltage Eng 41(3):902–907.
Chen C, Li J, Balasubramaniam V, Wu Y, Zhang Y, Wan S (2020) Contention resolution in wi-fi 6 enabled internet of things based on deep learning. IEEE Internet of Things J.
Jalaeian B, Zhu R, Samani H, Motani M (2014) An optimal cross-layer framework for cognitive radio network under interference temperature model. IEEE Syst J 10(1):293–301.
Huang D, Xie T, Zhang Y, Huang W, et al (2019) Target recognition based on fusing features of visible and two wave bands infrared images. J Imaging Sci Technol 63(1):10503.
Zhongyuan Z, Kang Y, Fochi W, et al (2014) Insulator hydrophobic identification based on image feature extraction and bp neural network. High Voltage Eng 40(5):1446–1452.
Lv Z, Hu B, Lv H (2019) Infrastructure monitoring and operation for smart cities based on IoT system. IEEE Trans Ind Inform 16(3):1957–1962.
Wan S, Xu X, Wang T, Gu Z (2020) An intelligent video analysis method for abnormal event detection in intelligent transportation systems. IEEE Trans Intell Transp Syst.
Cui J, Cao Y, Wang W (2015) Application of an improved algorithm based on watershed combined with Krawtchouk invariant moment in inspection image processing of substations. Proc CSEE 35(6):1329–1335.
Chen C, Liu B, Wan S, Qiao P, Pei Q (2020) An edge traffic flow detection scheme based on deep learning in an intelligent transportation system. IEEE Trans Intell Transp Syst.
Lv Z, Kong W, Zhang X, Jiang D, Lv H, Lu X (2019) Intelligent security planning for regional distributed energy internet. IEEE Trans Ind Inform 16(5):3540–3547.
Wan S, Xia Y, Qi L, Yang Y-H, Atiquzzaman M (2020) Automated colorization of a grayscale image with seed points propagation. IEEE Trans Multimedia 22(7):1756–1768.
Jia J, Ruan Q, Jin Y, An G, Ge S (2020) View-specific subspace learning and re-ranking for semi-supervised person re-identification. Pattern Recognit 108:107568.
Ying L, Zhihong G, Yufeng C (2015) Convolutionalrecursive network based current transformer infrared fault image diagnosis. Power Syst Prot Control 43(16):87–94.
Dong W, Qingwu G, Wenqing L, et al (2016) Research on internal and external fault diagnosis and fault-selection of transmission line based on convolutional neural network. Proc CSEE 36:21–28.
Andri R, Cavigelli L, Rossi D, Benini L (2018) YodaNN: An architecture for ultralow power binary-weight CNN acceleration. IEEE Trans Comput Aided Des Integr Circ Syst 37(1):48–60.
Liao Y, Yu N, Li Z, Tian D (2019) Low power CNN Accelerator for mobile lensless imaging system In: 2019 IEEE International Conference on Electron Devices and Solid-State Circuits (EDSSC), 1–3.
Guo Z, Chen Q, Wu G, Xu Y, Shibasaki R, Shao X (2017) Village building identification based on ensemble convolutional neural networks. Sensors 17(11):2487.
Zhang Y, Cui G, Deng F, Chen S, Wang Y, He Q (2018) Efficient query of quality correlation for service composition. IEEE Trans Serv Comput.
Zhang Y, Jin Y, Chen J, Kan S, Cen Y, Cao Q (2020) PGAN: Part-based nondirect coupling embedded GAN for person reidentification. IEEE MultiMedia 27(3):23–33.
Krizhevsky A, Sutskever I, Hinton GE (2012) ImageNet classification with deep convolutional neural networks In: Advances in Neural Information Processing Systems, 1097–1105.
Zang J, Wang L, Liu Z, Zhang Q, Hua G, Zheng N (2018) Attention-based temporal weighted convolutional neural network for action recognition In: IFIP International Conference on Artificial Intelligence Applications and Innovations, 97–108.. Springer, Cham.
Yao D-J, Yang J, Zhan X (2014) Feature selection algorithm based on random forest. J Jilin Univ 44(1):137–141.
Xi Y, Zhang Y, Ding S, Wan S (2020) Visual question answering model based on visual relationship detection. Signal Process Image Commun 80:115648.
Li L, Goh T-T, Jin D (2020) How textual quality of online reviews affect classification performance: A case of deep learning sentiment analysis. Neural Comput & Applic 32(9):4387–4415.
Acknowledgments
We want to thank the authors of the literature cited in this paper for contributing useful ideas to this study. The authors would like to thank the anonymous reviewers for their helpful insights and suggestions which have substantially improved the content and presentation of this paper.
Funding
The authors are grateful for National Key R&D Program of China (Technology and application of wind power / photovoltaic power prediction for promoting renewable energy consumption, 2018YFB0904200) and eponymous Complement S&T Program of State Grid Corporation of China (SGLNDKOOKJJS1800266).
Author information
Authors and Affiliations
Contributions
F. Zhou contributed on the design of CNN. Y. Ma and G. Lin presented the performance evaluation. B. Wang participated in the design and optimization of framework. All authors have read and approved the final manuscript.
Corresponding author
Ethics declarations
Competing interests
The authors declare that they have no competing interests.
Additional information
Publisher’s Note
Springer Nature remains neutral with regard to jurisdictional claims in published maps and institutional affiliations.
Rights and permissions
Open Access This article is licensed under a Creative Commons Attribution 4.0 International License, which permits use, sharing, adaptation, distribution and reproduction in any medium or format, as long as you give appropriate credit to the original author(s) and the source, provide a link to the Creative Commons licence, and indicate if changes were made. The images or other third party material in this article are included in the article’s Creative Commons licence, unless indicated otherwise in a credit line to the material. If material is not included in the article’s Creative Commons licence and your intended use is not permitted by statutory regulation or exceeds the permitted use, you will need to obtain permission directly from the copyright holder. To view a copy of this licence, visit http://creativecommons.org/licenses/by/4.0/.
About this article

Cite this article
Zhou, F., Ma, Y., Wang, B. et al. Dual-channel convolutional neural network for power edge image recognition. J Cloud Comp 10, 18 (2021). https://doi.org/10.1186/s13677-021-00235-9
Received:
Accepted:
Published:
DOI: https://doi.org/10.1186/s13677-021-00235-9