- Research
- Open access
- Published:
Take one for the team: on the time efficiency of application-level buffer-aided relaying in edge cloud communication
Journal of Cloud Computing volume 10, Article number: 24 (2021)
Abstract
Background
Adding buffers to networks is part of the fundamental advance in data communication. Since edge cloud computing is based on the heterogeneous collaboration network model in a federated environment, it is natural to consider buffer-aided data communication for edge cloud applications. However, the existing studies generally pursue the beneficial features of buffering at a cost of time, not to mention that many investigations are focused on lower-layer data packets rather than application-level communication transactions.
Aims
Driven by our argument against the claim that buffers “can introduce additional delay to the communication between the source and destination”, this research aims to investigate whether or not (and if yes, to what extent) the application-level buffering mechanism can improve the time efficiency in edge-cloud data transmissions.
Method
To collect empirical evidence for the theoretical discussion, we built up a testbed to simulate a remote health monitoring system, and conducted both experimental and modeling investigations into the first-in-first-served (FIFS) and buffer-aided data transmissions at a relay node in the system.
Results
An empirical inequality system is established for revealing the time efficiency of buffer-aided edge cloud communication. For example, given the reference of transmitting the 11th data entity in the FIFS manner, the inequality system suggests buffering up to 50 data entities into one transmission transaction on our testbed.
Conclusions
Despite the trade-off benefits (e.g., energy efficiency and fault tolerance) of buffering data, our investigation argues that the buffering mechanism can also speed up data transmission under certain circumstances, and thus it would be worth taking data buffering into account when designing and developing edge cloud applications even in the time-critical context.
Introduction
It has been identified that “interprocess communication is at the heart of all distributed systems” [1], while edge cloud applications are typical distributed software systems involving interprocess communication between the edge devices and the cloud. Given the booming wireless devices at the edge side, cooperative relaying becomes a promising technique to enhance the spectral efficiency and network coverage for wireless edge-cloud communications [2, 3]. More importantly, the relay nodes can supplement edge devices (e.g., sensors and actuators) with extra compute and storage capacities to strengthen the cooperative functionalities in edge cloud computing [4].
We are involved in an edge cloud computing project that can be simplified and demonstrated as a cooperative health monitoring system: Personal health parameters are periodically collected from wearable sensors and are initially processed by a nearby prediagnosis broker, before sending out to a remote hospital for further analytics. Following the business logic, naturally, we implemented the prediagnosis broker to process and transmit individual users’ data in a first-in-first-served (FIFS) manner. However, since the prediagnosis results are as small as a few kilobytes, there is a significant inefficiency in data transmission due to the low utilization of communication bandwidth. Therefore, we decided to upgrade the broker’s relaying with buffer that has been adopted to better take advantage of the network resource [5].
In fact, adding buffers to networks has been considered part of the fundamental advance in data communication [6]. By implementing buffers at different locations along the network link inclusively between data source and destination, the buffering mechanism can help obtain various benefits ranging from energy efficient transmission [7] to smooth streaming playback [8]. On the other hand, these benefits are generally considered to come with a cost of time, as the buffer “can introduce additional delay to the communication between the source and destination” [9]. Inspired by the metaphor of “Race Cars vs. Trailer Trucks” [10], we wonder if there is a win-win inflection point where the application-level buffering mechanism can increase throughput as well as improving time efficiency in data transmission. Thus, we proposed a counterintuitive research question to drive a separate study besides our project:
-
RQ1: Can the buffering mechanism speed up data transmission for edge cloud applications?
Although the tentative answer to RQ1 is YES in our hypothesis, the speedup effects could vary for different applications on a case-by-case basis. Therefore, we also proposed a follow-up research question:
-
RQ2: To what extent can the buffering mechanism speed up data transmission for an edge cloud application?
It should be noted that RQ2 is based on the answer YES to RQ1. In other words, if the answer to RQ1 is NO, it will be unnecessary and meaningless to look for answers to RQ2 then.
To pursue answers to these research questions, we set up an edge-cloud testbed to represent the aforementioned cooperative health monitoring system, and conducted experiments to compare the time consumption between the FIFS and the buffer-aided communications. Based on the experiments, we further performed modeling investigation to better understand the nature of how the buffer would help speed up data transmission. The experimental and modeling investigations eventually established an empirical inequality system for revealing the time efficiency of buffer-aided communication on our testbed. For example, given the reference of transmitting the 11th data entity in the FIFS manner, the inequality system suggests buffering and uploading up to 50 data entities as one transaction from an edge device to the cloud. Although the buffer-aided data transmission could have delayed the first ten data entities’ arrival in this case, we claim that the communication time efficiency has been significantly improved from the overall data’s perspective.
It is noteworthy that, in this study, the buffered objects are homogeneous atomic data entities (i.e. the prediagnosis reports in our testbed) operated by applications rather than data packets operated by network protocols. To be specific, we clarify the definition of atomic data entity as follow.

As such, a typical feature of our study is the investigation into the application-level buffering for programmatically controllable communication transactions. In contrast, buffering data packets is invisible to applications, as the deployment and utilization of buffers are implemented transparently by the relevant protocols at lower network layers [4, 6, 12].
The experimental testbed employed in this research is partially reused from our earlier paper “Characterising Edge-Cloud Data Transmission for Patient-centric Healthcare Systems” [13] published in the Proceedings of the 22nd IEEE International Conference on E-health Networking, Application & Services (HealthCom 2020). As the original edge-cloud testbed is abstracted from a real-world project (i.e. cooperative remote health monitoring), it is more meaningful to keep using the concrete use case of health monitoring to demonstrate this research, rather than come up with made-up application scenarios. However, it should be noted that our current work is completely a new study with more comprehensive investigations than [13], driven by new research questions.
Overall, by reporting our study on the time efficiency of buffer-aided data transmission in the edge-cloud context, this paper mainly makes a twofold contribution:
-
For researchers, our work not only reveals the positive proportional relationship between buffering and communication speed under certain circumstances, but also pinpoints new research opportunities of optimizing the time efficiency in buffer-aided data transmission. For example, compared with Nagle’s algorithm that refers to the maximum segment size as the fixed buffer size, this research argues to use a latency inequality system to regulate a wide range of adjustable buffer sizes, so as to adapt to some dynamic circumstances conveniently and programmatically (e.g., when involving different task priorities).
-
For practitioners, our experimental and modeling investigation demonstrates a reusable methodology of communication performance engineering. This methodology can not only help identify the feasibility and effectiveness of using buffers to speed up data transmission, but also help guide buffer tuning with respect to specific edge cloud applications. Since there is no one-size-fits-all latency inequality system to enhance the time efficiency of buffer-aided data relaying, it is crucial and valuable to follow a standard methodology to engineer the communication performance and characteristics of different applications even at different relay nodes.
The remainder of this paper is organized as follows. “Related work” section summarizes the related work according to different buffering locations. “Theoretical discussion” section draws theorems and their proofs to discuss the theoretical conditions of using buffers to speed up data transmission. Based on the theoretical discussion, “Experimental investigation” and “Modeling investigation” sections describe our experimental investigation and modeling investigation respectively. Three limits to the validity of our current work are highlighted in “Limits to validity” section. Conclusions are drawn and some future work is introduced in “Conclusions and future work” section.
Related work
By ignoring the study contexts, most data transmission scenarios in the literature can be abstracted into a data trajectory from a source node (or more) to a destination node (or more), optionally via a relay node (or more) somewhere in between. Thus, according to different buffering locations, we use the three-node network topology to roughly classify the current studies on buffer-aided data transmission, as shown in Fig. 1 and explained below. Note that the buffers can be implemented at multiple locations simultaneously (e.g., network messages are buffered at both the source side and the destination side [14]).

Three buffering locations in buffer-aided data transmission
1) Source-side Buffering.
Considering the buffering overhead in terms of time consumption, implementing buffer from the source side is generally discussed in the context of delay tolerant data transmission [15]. In other words, the source-side buffering has mainly been employed to trade off transmission time in exchange for other benefits, as vividly described in [10] using the metaphor of “Race Cars vs. Trailer Trucks”. For example, when network is underutilized for catering the incoming data, concatenating multiple data units into a single large transmission burst will significantly increase the network efficiency [16]. Benefiting from the increased network utilization, correspondingly, large-size data transmissions will be more energy efficient [7]. An opposite use case is to use managed buffering to avoid network congestion and improve transmission reliability when many source nodes attempt to send data simultaneously [17, 18]. In addition, buffering data and lowering transmission frequency have been advocated to decrease the power usage and maximize the lifetime of source nodes [19, 20].
As for this research, despite the different buffering location, we still target the time efficiency of data transmission without pursuing the other trade-offs.
2) Relay-side Buffering.
As edge cloud computing is based on the heterogeneous collaboration network model [21, 22] in a federated environment [23], it is natural to observe application-level data relay nodes and even intentionally design data relaying for edge cloud applications. In contrast, the frequently discussed packet relaying across the Internet is invisible from the application’s perspective. Thus, here we distinguish between the application’s view and the packet’s view of data relaying, as illustrated and compared in Fig. 2.
-
Studies from the data packet’s perspective: In practice, there is no perfect-condition network link between any data source and destination. Thus, relay nodes have been proposed and employed to cooperate with source and destination nodes to obtain various non-functional gains when transferring data in cooperative systems. For example, in the wireless sensor network, there have been transport protocol implementations that can reduce data retrieval latency by buffering the data in the nodes near the destination [4]. Under dynamic-rate transmission situations, advanced buffer-aided relaying protocols are developed to help reduce delay through adaptive link selection [12]. By involving relay nodes for selecting better-condition channels, buffer-aided relaying has been proved useful to improve the transmission reliability and the sum throughput when the destination node includes non-orthogonal multiple access users [24]. In addition to the benefit of performance improvement, the relay-side buffering is also advocated to be able to enhance the communication security [25]. Overall, these studies are generally focused on buffering data packets and frames at the lower layers of the network stack (e.g., the underlay cognitive radio network [26]) for link selection or route optimization, while the developed protocols and techniques are used transparently for data communication of applications.
-
Studies from the application’s perspective: Visible and predesigned data relaying at the application level can be exemplified by the business logic of electrocardiography (ECG) telemonitoring systems. Driven by different concerns, the relay node is designed to play various functional roles in the ECG systems. For example, the store-and-forward functionality is to save transmission cost [27], the encryption functionality is to safeguard the privacy of personal information [28], and the analytical functionality is even intended to prevent major medical conditions before visiting hospitals [29]. Note that the real-time mode in the studies like [27, 30] for immediately transferring patient data after acquisition is out of the scope of our discussion, as these cases do not equip the relay node with any extra functionality other than passing on the data.

Two different views of data relaying in edge cloud computing
As mentioned previously, this research is focused on the application-level communication transactions instead of their underlying data packets, and the communication transactions are programmatically controllable when implementing buffering mechanisms in the application business logic. On the other hand, compared with the existing application-level relay-side buffering studies that generally aim to obtain extra beneficial features by sacrificing (or ignoring) timely data transmission, this research particularly investigates the time efficiency and targets the improvement of time efficiency in application-level buffer-aided data relaying.
3) Destination-side Buffering.
After data arrive at destination, they can still be buffered before being consumed. This seems to be a widely applicable strategy when the destination node is end user devices. Considering the uncertain and unstable connectivity in the client environment, many edge cloud applications have allowed prefetching and buffering data for later usage when the network backbone has high service qualities [31]. For example, GPS Navigation can still be functional during the signal blockage in a tunnel, if there are prefetched and buffered data. Even if the connectivity is not a concern, prefetching and buffering data are still crucial to guarantee the consecutive and smooth playback in high-degree-of-freedom video streaming systems [8, 32]. In fact, given the pervasive multimedia terminals in the modern daily life of people, buffering multimedia data transmitted over the Internet or television cable has become a successful industry practice to improve user experience and customer satisfaction, as reflected by a bunch of patents [33, 34].
In this research, we are only concerned with the timely arrival of the data from the sender’s perspective, while further data buffering/processing at the destination is out of the scope of this paper.
Theoretical discussion
When transferring data in multilayer networks like the Internet, there are inevitable overheads for crossing different layers [7, 35]. Therefore, from the application layer’s perspective, there is a fixed minimum time consumption of data communication transactions (or the fixed time consumption of minimum-size communication transactions), no matter how trivial the bandwidth utilization is. As an initial study on trying to speed up data transmission by improving bandwidth utilization, here we are only concerned with the situation of applying buffers to the minimum-size communication transactions. Consequently, the buffering effectiveness must have a limited range constrained by the characteristics of such a situation. To facilitate unfolding the experimental and modeling investigation, we firstly analyze the theoretical potential of making data communication more time efficient, by coming up with a set of lemmas and theorems and their proofs.
Since characterizing the aforementioned situation is the prerequisite to drawing lemmas and theorems, we exemplify and discuss different timings of transmitting an atomic data entity, as illustrated in Fig. 3. It should be noted that we constrain the atomic data entities here to be homogeneous (e.g., prediagnosis reports of different patients) with more or less the same data sizes, so as to align with the practical situation in our case study (cf. “Experimental investigation” section). In particular, each atomic data entity has four states in its communication life cycle:
-
Process is the state when the data entity is being processed or being generated.
-
Wait is the state when the data entity is ready to be transferred at its sender’s side.
-
Transmit is the state when the data entity is on the way between its sender and receiver.
-
Arrive is the state when the data entity has arrived at its receiver.

Timing diagram of transmitting an atomic data entity waiting at tw
From the infrastructural perspective, the network link between the data sender and receiver can stay purely idle, standby while buffering, and occupied by catering communication transactions. Thus, assume an atomic data entity is ready at time tw, we take into account five communication options for later discussions:
-
Option 1 describes the baseline scenario where no buffering mechanism is implemented. The atomic data entities are transferred successively in the first-come-first-served fashion from time t0.
-
Option 2 shows a buffering mechanism that delays data transmission to a later time, even though at least one atomic data entity has been ready to be transferred since t0.
-
Option 3 helps explain that the buffering mechanism can be adjusted to have different buffering time spans. Note that the buffering time span is not necessarily proportional to the buffer size, e.g., longer buffering time span may come with lower buffering rate.
-
Option 4 highlights the special buffering time span that is exactly equal to the minimum time consumption of communication transactions.
-
Option 5 portrays the buffering mechanism whose buffering time span is longer than the minimum time consumption of communication transactions.
Then, we pursue the effective buffering conditions of being able to speed up data transmission, by respectively discussing the buffering time span, the total size of buffered data, the size of individual atomic data entities, and the buffering speed. In particular, the following notations in Table 1 are used in the theoretical discussion here and in “Modeling investigation” section:
Lemma 1
Given Tcc as the time consumption of the minimum transactional data communication, the effective buffering time span Tbf for the adjacent communication transaction is constrained by
Proof
On the contrary, assume we employ the buffering Option 4 and 5 (cf. Fig. 3) where
When a random atomic data entity is ready to be transferred at tw, Option 4 will transfer it at the same time t1 as Option 1 will do, while Option 5 will delay its arrival to the cloud side. Thus, the buffering mechanism is meaningless in both options from the perspective of this data entity. This completes the proof. □
Lemma 2
Given the bandwidth B of the network between the edge and the cloud, the size Dbf of buffered data that can be transferred through the adjacent communication transaction with time span Tcc is constrained by
Proof
Network bandwidth indicates the maximum data transfer rate of a wired or wireless communication link, which physically constrains the maximum capacity of data communication over a period of time (Tcc in this case), not to mention that the actual data throughput (or effective bandwidth) is usually smaller than the theoretical bandwidth value [36]. This completes the proof. □
Theorem 1
Let B and Tcc be the network bandwidth and the time span of a communication transaction respectively. Then, the average size d of homogeneous atomic data entities to be buffered is constrained by
Proof
On the contrary, assume the size of an individual atomic data entity is bigger than the constraint, i.e.
Taking into account the overall size of buffered data
where di indicates the size of the ith atomic data entity. As constrained previously, d1,d2..., and dn are roughly the same.
Then, even buffering two (i.e. n=2) of such data entities will violate Lemma 2. In other words, it will be impossible to implement the buffering mechanism for speeding up data transmission in this case. This completes the proof. □
Theorem 2
Define the buffering speed (i.e. the incoming rate of atomic data entities) as
where n data entities are buffered during the time span Tbf.
Then the effective buffering speed λ falls within the range:
where Tcc represents the time span of a communication transaction, B indicates the network bandwidth, and d is the average size of the buffered atomic data entities.
Proof
We separate Theorem 2 into two parts (i.e. 2/Tcc<λ and λ≤B/d) and give corresponding proofs respectively.
Part 1: In practice, it is meaningless to buffer one atomic data entity only. Therefore, the practical buffering speed should satisfy
If Lemma 1 is satisfied, i.e. Tbf<Tcc, then
Part 2: On the contrary, assume the effective buffering speed is beyond the range’s upper bound, i.e.
Recall \(D_{{bf}} = \sum _{i=1}^{n} d_{i} = d\times n\), then we have
However, the network bandwidth is the communication link’s physical property that cannot be exceeded. In other words, the bandwidth B cannot afford the theoretical data throughput Dbf/Tbf at the data incoming rate λ. Then, λ is not appropriate for effective buffering, which arrives to a contradiction and completes the proof. □
Overall, the discussion here has theoretically answered RQ1 with YES, by revealing the possibility and opportunity of using application-level buffer-aided mechanism to improve the time efficiency in data transmission, as well as the required conditions to be satisfied.
Experimental investigation
To obtain empirical evidence to verify and demonstrate the theoretical discussion in “Theoretical discussion” section, we conducted an experimental study on different efficiencies of data communication of an edge cloud application. The application scenario is assumed to be remote health monitoring that was also used in our earlier study [13], as shown in Fig. 4. In this scenario, we consider the application’s business logic to be: (1) wearable sensors continuously detect the host patients’ health parameters and send their values to a closeby broker; (2) the broker periodically processes the collected raw data into prediagnosis reports that are atomic data entities in this case; and (3) once a prediagnosis report is ready, the broker immediately sends it to a hospital who remotely monitors the health status of those patients. Moreover, we constrain that each prediagnosis report should be small enough to satisfy Theorem 1. Then, we focus on the one-way communication from the broker to the hospital for our investigation, which essentially corresponds to the relay-destination transmission described in “Related work” section.

The scenario of cooperative remote health monitoring [13]
Testbed setup
We distinguish between the application and its runtime environment when building up a testbed for this experimental investigation. In particular, the runtime environment is further decomposed into two parts for the sender (i.e. relay instead of original data source, as represented by Prediagnosis Broker in Fig. 4) and receiver (i.e. destination, as represented by Cloud (Hospital) in Fig. 4) of the prediagnosis reports respectively, as specified below.
-
Application. We developed a mobile app with Android Studio to simulate the health monitoring application.Footnote 1 To simplify the sensor data collection (from Wearable Sensors in Fig. 4) that is out of this study’s focus, we pre-stored a group of “people’s” health parameters in a JSON-format file to mimic the moment when the broker is ready to do prediagnosis. The prediagnosis is composed of simple comparison measures against standard values, which can be quickly done including generating PDF-format reports.Footnote 2
-
Report Sender (i.e. Prediagnosis Broker that plays the relay role in the application). The developed mobile app is deployed on a Redmi Note 8 Pro handset with the CPU Octa-core (2x2.05 GHz Cortex-A76 & 6x2.0 GHz Cortex-A55) and the operating system Android 9.0 (Pie). Here we let the handset play the broker role who tries to send out prediagnosis reports to the remote cloud (hospital) at soon as possible. In particular, the handset works in a stable WiFi environment with about 101 Mbps download speed and 5.6 Mbps upload speed (measured by using the Speedtest appFootnote 3).
-
Report Receiver (i.e. Cloud (Hospital) that plays the destination role in the application). Since this study is focused on the data communication only, the post-transmission activities of health monitoring (e.g., cumulative data analytics, setting off alarms, etc.) are out of the scope of this paper. Therefore, we assume that the role of remote hospital merely keeps the prediagnosis reports after receiving them. In this testbed, we employed Firebase StorageFootnote 4 to act as the report receiver. Considering that Firebase Storage is backed by Google Cloud StorageFootnote 5, the transmitted data are eventually stored in the Google cloud, which essentially enables our testbed to reflect real edge-cloud application features.
Note that, following the definition of atomic data entity, here we treat each prediagnosis report as a coherent and irreducible message from the sender to the receiver. Since each report has about 1.4 KB of data, the atomic data entity in this testbed clearly satisfies the aforementioned size constraint.
Two transmission mechanisms
As demonstrated in Fig. 3 via different communication options, we take into account two mechanisms for transmitting prediagnosis reports in the scenario of remote health monitoring, namely FIFS transmission and buffer-aided transmission.
-
FIFS transmission is part of the traditional and straightforward implementation of the application’s business logic. In this implementation, an instance of data transmission (i.e. an uploading request) starts immediately after the prediagnosis processing delivers a report. Given a set of jobs of pre-diagnosing a group of people’s health status, the delivered reports are transmitted consecutively in the FIFS manner, as shown in Fig. 5(a). It is noteworthy that the FIFS transmission mechanism corresponds to the illustrated Option 1 of data communication in Fig. 3, and it also acts as the baseline for us to study the buffer-aided transmission mechanism.
Fig. 5 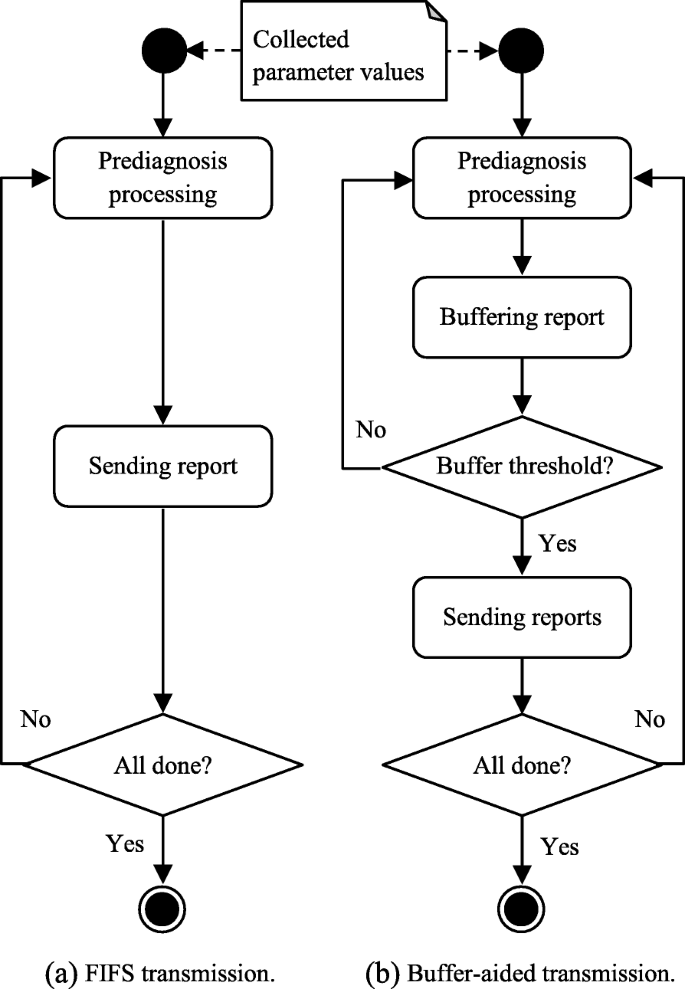
Activity diagram of the two mechanisms for transmitting prediagnosis reports
-
Buffer-aided transmission temporarily keeps the generated prediagnosis reports and delays their transmission until reaching a predefined buffer threshold. Then, the buffered reports will be transmitted all at once rather than individually, as shown in Fig. 5(b). It is noteworthy that the buffering mechanism here makes common sense, without requiring unique techniques or sophisticated manipulations. As such, we expect this research to draw relatively generic conclusions with respect to the time efficiency of buffer-aided relaying in edge-cloud data transmissions. Particularly, in our developed app, since Firebase Storage allows an upload task to include a single file only, we merge the generated individual reports into one PDF file when buffering them. Correspondingly, we predefine and adjust the buffer threshold by varying the number of reports to be merged. In other words, we manually control the eventually programmatically adjustable buffer size in this research. As such, we are able to gradually investigate the effective buffering range, as demonstrated in Fig. 3 with regard to Option 2, Option 3, and Option 4 of data communication.

Measurement metrics
This study on data transmission’s time efficiency is essentially to engineer the communication performance of edge cloud applications. Since the selection of measurement criteria or metrics plays a prerequisite role in performance engineering for communication and computing systems [37], practitioners need to decide what to measure before conducting the experiments.
Following the theoretical timing discussion about data communication (cf. “Theoretical discussion” section), we choose the primary metric to be Latency that is widely used to measure the elapsed time of an activity, a process, or a task/job. Thus, ideally, we can use different timers in the testbed to obtain the latencies of data processing, waiting/buffering, and transmitting report for every single prediagnosis task.
However, since the public cloud environments are uncontrollable (often invisible) from the perspective of cloud users [36], it is impossible for us to set any timer inside Firebase Storage from the cloud. Instead, Firebase Storage allows app development to use an OnSuccessListener to know if a report is uploaded successfully or not. As such, although we cannot obtain the exact timestamp when a report arrives to its receiver (in the cloud), it is still convenient to understand each report’s successful uploading latency, at least from the sender’s perspective. In detail,
-
under the FIFS mechanism, we employ four timers in every prediagnosis task: (i) when the prediagnosis processing starts; (ii) when the prediagnosis report is generated; (iii) when the report uploading starts; and (iv) when the report is uploaded successfully. The expected measurement results are then named as Processing Latency from Timer (i) to (ii), Waiting Latency from Timer (ii) to (iii), and Uploading Latency from Timer (iii) to (iv). In particular, here we define Transmission Latency to be equivalent to the uploading latency in this case.
-
under the buffering mechanism, we employ four timers with respect to each uploading event: (i) when the prediagnosis processing starts; (ii) when the buffering starts (as soon as the buffer size is saturated); (iii) when the uploading event starts (as soon as the buffering is done); and (iv) when the buffered reports are together uploaded successfully. The expected measurement results are then named as Processing Latency from Timer (i) to (ii), Buffering Latency from Timer (ii) to (iii), and Uploading Latency from Timer (iii) to (iv). Note that, unlike under the FIFS mechanism, the processing latency here covers the generation of multiple prediagnosis reports (depending on the buffer size). Moreover, to be consistent with the discussion in “Related work” section, we define Transmission Latency in this case to be the combination of buffering latency and uploading latency.
Experimental analysis of FIFS transmission
Following the principles of Design of Experiments (DOE) [38], we repeated the FIFS health monitoring experiment multiple times (five times in specific) for 50 made-up individuals, and then calculated average values of latency indicators. According to the experimental results, there is no waiting latency between the data processing and report uploading in the individual prediagnosis tasksFootnote 6, as illustrated in Fig. 6. In terms of “waiting”, there are merely queuing delays for the later tasks due to the FIFS nature. Such a phenomenon is the result from a combination effect of the asynchronous mechanism of Firebase Storage and the single-thread generation of prediagnosis reports. Since the performance bottleneck is data processing rather than data transmission in this case, none of the generated prediagnosis reports needs to wait to be uploaded.

Latency measurements for dealing with 10 consecutive prediagnosis tasks on our testbed. T1, T2..., and T10 indicates the 10 tasks respectively. The three parts of each line indicate the task queuing delay, the patient data processing latency, and the prediagnosis report uploading latency respectively (one millimeter represents 10 milliseconds)
We believe that the waiting time in the prediagnosis tasks will appear when we speed up the report generation, e.g., through multi-thread processing. However, the investigation into multi-thread report generation has been intentionally excluded from this study. Recall that the broker role is played by an edge device in this research. Given the huge heterogeneity in edge devices and technologies [39, 40], we have to conservatively relax the assumption of brokers’ multi-thread processing capacity. For example, the broker in this research can also be implemented on a WiFi-supported Arduino YUNFootnote 7 that has limited compute resources.
To facilitate discussing our observations, we demonstrate the average measurement results for the first 10 reports in Fig. 6. In specific,
-
1)
The dash green part of each line indicates the queuing delay before processing the corresponding patient’s data. It is clear that data processing for the first patient does not have any delay.
-
2)
The tiny red part of each line represents the data processing latency until delivering the prediagnosis report. Given the simple prediagnosis logic in our testbed, generating one report takes from about six ms to 22 ms.
-
3)
The long blue part of each line shows the report uploading latency between the moment when the prediagnosis report starts transmission and the moment when the successful uploading is heard (by the OnSuccessListener).
Such measurement results have denied the previous hypothesis of serial data transmission illustrated in Fig. 3, i.e. there are only task queuing delays instead of any waiting latency before transmitting individual reports. This also justifies the needs of empirical investigation in addition to theoretical discussion. Benefiting from the asynchronous strategy of Firebase Storage (i.e. putFile() in our testbed), the successor prediagnosis task can be launched right after starting the precursor report transmission. Thus, the individual reports are generated regularly about every 10 ms on average, indicating roughly the same overhead of single-thread data processing. Meanwhile, the transactions of report uploading are also issued regularly, with overlapping time windows, in parallel.
However, there exhibits a trend that although the data transmission transactions start regularly, it would take longer and longer time (wall-clock latency) to finish the continuous prediagnosis tasks, especially after the first several ones. This phenomenon can be narrowed down to the uploading latency, as portrayed in Fig. 7.

The 50 prediagnosis reports’ uploading latencies under the asynchronous FIFS transmission mechanism, together with their two-part linear regression analysis
The shape composed of plotted uploading latencies is similar to a hockey stick. The measurement result keeps increasing regularly from uploading the fourth report on. Considering the low network utilization in this case, we believe this phenomenon is because of the incremental resource competition when saving reports and/or the queuing delay of issuing response signals from the receiver side (in the cloud).
To verify such an explanation, we further tested serial data transmission by forcing the later uploading events to wait for the former success signals. Ideally, there should not be resource competition anymore in the new test. Thus, according to the illustrated results in Fig. 8, we claim that the plain uploading latency of a single report can be as short as less than 300 ms on our testbed. This confirms that the longer latency of uploading individual reports via Firebase Storage’s asynchronous approach must have involved extra noises, and one noise source must be the resource competition when uploading data asynchronously. However, by focusing on the wall-clock latency of multiple tasks from the holistic perspective, the asynchronous FIFS transmission is still more efficient than the serial data transmission. Therefore, we stick to the asynchronous uploading for investigating the FIFS transmission mechanism in the rest of our study.

The 50 prediagnosis reports’ uploading latencies under the serial FIFS transmission mechanism
Experimental analysis of buffer-aided transmission
Given the above lessons from the experimental analysis of FIFS transmission, it is foreseeable that the asynchronous buffer-aided transmission will also come with extra measurement noises. To better isolate and compare different buffering effects, we decided to emphasize the standalone communication transactions’ latencies, by experimenting with serial transmission of buffered data.
When it comes to observing different buffering effects, since controlling the buffering time will introduce higher overhead (e.g., frequent timestamp comparisons) in the testbed, we vary the buffering threshold by modifying the amount of prediagnosis reports to be buffered, i.e. adjusting the buffer size instead of controlling the buffering time. In fact, when successively including reports in one communication transaction, the buffering time window will correspondingly be expanded in a fine-grained manner, as demonstrated from Option 2 to Option 3 in Fig. 3. Thus, focusing on the buffer size still allows us to match our empirical investigation with the previous theoretical discussion about the buffering time span (e.g., Lemma 1).
In detail, we performed 49 experimental trials of buffering two, three,..., and 50 prediagnosis reports respectively. Note that “buffering” one report is meaningless in practice, as justified in Theorem 2. For each buffer size, the corresponding trial continuously buffered and transmitted data entities 50 times in the serial manner, and also recorded relevant timestamps of the 50 transactions. After using the function TRIMMEAN (array, 20%) to exclude potential outliers, we calculated the average latencies of a single transaction with respect to different buffer sizes, as plotted in Fig. 9.

Latencies of a single transmission transaction with respect to different buffer sizes, together with the linear regression analyses. The upper scatters indicate the latency of report buffering and uploading, while the lower scatters indicate the uploading latency only
As can be seen, along with the increasing buffer size, the latency trajectories generally show an upward trend. In particular, the lower trajectory represents the uploading latency only. Its upward trend indicates that the data size still proportionally influences the uploading latency, even at the kilobyte level. The upper trajectory represents the combination of both the buffering latency and the uploading latency. Thus, the distance between those two trajectories reflects the influences of buffering on the whole transmission latency. Despite the common sense that buffering more data would take longer time, the buffering overhead (against the data size) will gradually dominate the transmission latency when the buffer size keeps increasing, as revealed by the slope difference between the lower and the upper trajectories.
Modeling investigation
Modeling is a powerful scientific approach to revealing the nature of complex systems ranging from a software module to the universe, by abstracting real-world objects or processes that are difficult to observe or understand directly [41, 42]. To help understand how the buffering potentially speeds up data transmission, we also abstract the previous experimental work into models, so as to concisely and formally perform a comparison investigation between those two data transmission mechanisms. In particular, to be consistent with the experimental investigation, we model the whole workflow of FIFS transmission while only model a single transaction of buffer-aided transmission.
Modeling analysis for FIFS transmission
Inspired by the hockey-stick shape in Fig. 7, we conducted a two-part linear regression analysis via Excel Analysis ToolPak (for uploading the first four and the last 47 prediagnosis reports respectively), so as to better understand the edge-cloud data transmission in our application scenario. Note that, since the fourth report acts as the inflection point in the shape, we included it in the both parts of the analysis. The analytical results with respect to the main indicators are listed in Table 2 and briefly explained as follows.
-
Observations are the sample size for conducting a regression analysis. As mentioned previously, our analysis includes two parts covering four and 47 prediagnosis reports respectively.
-
Intercept and (Index) Coefficient are two constant parameters to build a linear regression model between two variables, by following the equation in Eq. (1). In particular, we regard the sequential position (index) of a prediagnosis report as the independent variable that can “explain” why the uploading latency (as the dependent variable) changes.
$$ y=\text{Coefficient}\cdot x + \text{Intercept} $$(1)where y represents the data transmission latency of uploading the xth report within a group of continuous prediagnosis tasks.
-
Abs(Correlation Coefficient) is the absolute value of the correlation coefficient that measures the linear relationship between two variables. The value bigger than 0.999 indicates a strong correlation between the index and uploading latency of prediagnosis reports in most of the cases (i.e. Part II). However, although the visualization (cf. Fig. 7) of Part I also shows a roughly linear trend, the statistical result does not support such an assumption.
-
Coefficient of Determination indicates the percentage of the dependent variable’s variation (i.e. latency changes in this case) that can be explained by the independent variable (i.e. report index in this case). The determination above 99% in the data of Part II shows a good fit of the linear regression model. In contrast, the fit of Part I’s model is poor.
-
Standard Error acts as an absolute measure to reflect the average error between the real data and the regression line. For instance, there would be about 77 ms error on average when using the second-part regression model to predict report uploading latency.
-
SignificanceF reveals the probability that the entire regression model is wrong and should be rejected. Since we have only one independent variable in this study, the Significance F here is equal to the p-value that applies to the coefficient Index. The extremely small value in Part II have statistically confirmed the strong reliability of the modeling result. On the contrary, we should reject the first model for the data in Part I.
After trying to build linear regression models for the two-part analysis, we eventually compose a piecewise function of report uploading latency, as shown in Eq. (??).

where Lfifs(i) indicates the latency of uploading the ith report under the FIFS mechanism. As explained with respect to the indicators, the first model should be rejected, because it does not fit the observations well. On the other hand, it may not be practical to use such a small amount of observations to build regression models. For example, it has been identified that both false positives and false negatives will occur in regression analyses if the sample size is less than eight, even with very low variance [43]. Therefore, we intentionally omit the first three observations while include i=4 in the second piece of the function.
In addition to the statistical confirmation, we employed new datasets to validate the applicability of the established model. Despite the slight variation in the measurement results from trial to trial, it seems that individual reports’ uploading latencies will generally increase alongside enlarging the group size of prediagnosis tasks. This could be caused by the thread pool adjustment in the cloud, and it should be worth future investigations. At least with similar-scale group sizes, we can always obtain acceptable prediction results through this piecewise function. For example, the validation results from a 100-task experiment are exemplified in Table 3. It is noteworthy that all the residuals stay within an error bound of 5%.
Modeling analysis for buffer-aided transmission
Given the roughly linear upward trend of the latency trajectories, we also use the linear regression modelling to abstract and analyze the latency characteristics of buffer-aided transmission (cf. Fig. 9). The detailed analysis outputs in terms of the aforementioned indicators are specified in Table 4.
In brief, the large absolute value of the correlation coefficient (about 0.99) in both trajectories justifies the strong correlation between the buffer size and the latency of buffer-aided transmission. The large Coefficient of Determination value (over 97%) together with the trivial Significance F value (less than -40 orders of magnitude) statistically confirm the good fit and reliability of the linear models against the 49 observations, as shown in Eq. (2) and Eq. (3).
where Lbf−up(s) indicates the latency of uploading the buffered s prediagnosis reports, and the buffer size is accordingly measured as s.
where Lbf(s) indicates the combinatory latency of buffering and uploading s prediagnosis reports, and the buffer size is also s.
Similarly, we also enlarged the maximum buffer size and conducted new experiments to validate these two models. The validation results are exemplified in Tables 5 and 6 respectively. The generally small residuals prove that the established models are suitable for predicting the performance of buffer-aided transmission on our testbed, even with larger buffer sizes. Recall that we adjust the buffer size by controlling the amount of prediagnosis reports to be buffered. Thus, the buffers in our experiments are always saturated when uploading the buffered data, no matter how big the buffer sizes are.
Conjoint modeling analysis to answer RQ2
As mentioned in “Introduction” section, RQ2 is defined based on the hypothesized answer (i.e. YES) to RQ1, while the discussion in “Theoretical discussion” section has theoretically answered RQ1 with YES, i.e. the application-level buffering mechanism can speed up data transmission from the edge to the cloud. Therefore, the modeling analysis here aims only to answer RQ2, i.e. to what extent the application-level buffering mechanism can speed up data transmission from the edge to the cloud. In fact, given the dependency of RQ2 on RQ1, the modeling analysis together with the previous experimental investigation will empirically reinforce the answer YES to RQ1, no matter what the answer to RQ2 is.
From the perspective of a single prediagnosis report (cf. “Theoretical discussion” section), the buffer-aided transmission will be preferred if it makes the report arrive earlier than the FIFS manner does. Benefiting from the respective modeling analyses of the two transmission mechanisms, we can conveniently conjoin their latency models and mathematically compare their time efficiency. Since the buffering overhead should also be included in the time efficiency comparison, we employ Eq. (3) for buffer-aided transmission to perform the conjoint modeling analysis with Eq. (??) for FIFS transmission. The aforementioned situation from the single report’s perspective can then be abstracted into the following system of inequalities:
In particular, s>i guarantees that the ith prediagnosis report must have been buffered. Meanwhile, \(L_{{fifs}}(i) \geqslant L_{{bf}}(s)\) regulates when involving the buffering overhead is worth it for the ith report. By ignoring the first three reports and by further substituting Eq. (??) and Eq. (3) into (4), we rewrite the inequality system as:
Since the buffer size s can only be a positive integer, we use the floor operation ⌊⌋ to constrain the solutions to the inequality system to be integer values. Note that, by using the ith report (and essentially its FIFS transmission latency) as the reference, the buffering mechanism could have sacrificed the performance of transmitting the first (i−1) reports for the whole “team” of the buffered data.
Despite the difference between buffering atomic data entities (i.e. prediagnosis reports) and buffering underlying packets, the buffer-aided transmission mechanism here with a fixed reference (i.e. a particular report in the pipeline) is similar to Nagle’s algorithm [44] that refers to the maximum segment size to improve the efficiency of TCP/IP networks. Nevertheless, the advantage of this research is the developed inequality system that regulates a wide range of changeable references for setting buffer sizes. This allows our buffer-aided transmission mechanism to be able to conveniently adapt to some dynamic circumstances. For example, when involving different task priorities, we can programmatically employ the inequality system (5) to adjust buffer sizes automatically by referring to the high-priority tasks.
Driven by RQ2, we measure the wall-clock latency of prediagnosis tasks to validate this conjoint analysis result, in order to reflect and compare the practical effects of different transmission mechanisms. In particular, for the purpose of consistency, we still use the serial approach to implement buffer-aided transmission in the validation experiments.
For example, by referring to the 11th report, we can set the buffer size as big as 50 according to the inequality system (5). In practice, given a 50-task job, completing the job in the FIFS manner will take about 7694 ms in total, while the buffer-aided transmission will help reduce the job’s wall-clock latency down to 2025 ms. We also tried the other buffer sizes, as illustrated in Fig. 10. It is clear that small sizes of buffer will make the performance even worse, due to the nature of serial transmission here. The bigger buffers can generally speed up the job, and some medium-size buffer (e.g., 25) seems to be able to bring the best performance in this case. However, the performance difference will also vary depending on the job size, while the buffer size optimization with respect to different job sizes is out of the scope of this paper.

Wall-clock of latency of completing 50 continuous prediagnosis tasks on our testbed. FIFS indicates the FIFS transmission mechanism, while the others indicate the buffer-aided transmission mechanism with respect to different data sizes
Note that, when 50 is not exactly divisible by a buffer size, we supplement extra tasks to saturate the buffer of the final transmission transaction, so as to obtain the conservative measurement result for more confidence in performance comparison. For instance, the 50-task job will require two uploading events even if the buffer size is 49, and accordingly we will give 48 more tasks to the job in the experiment).
Limits to validity
We applied a specific application scenario (i.e. cooperative remote health monitoring) to investigating the time efficiency in buffer-aided edge-cloud communication. Thus, the findings from this study might suffer from a set of limits, mainly related to the application-specific workload characteristics and the data-type-specific buffering technique. By highlighting the limits to the validity of our current work, on one hand, we try to remind readers of this study’s research scope; on the other hand, we expect to attract more attentions and efforts to bring more empirical evidence for this research topic.
1) Application-specific Workload Regime.
This study emerges from a real-world healthcare project, and the project requires periodically transmitting atomic data entities (i.e. the kilobyte-scale prediagnosis reports) rather than streaming raw sensor signals. Since one edge unit (i.e. a prediagnosis broker) is in charge of less than 50 patients according to the requirements, we estimate that the network is not saturated under both data transmission mechanisms, from the single edge unit’s perspective. Correspondingly, our findings could not be applicable for saturated network scenarios (e.g., with large atomic data entities per patient).
Despite such a limit, we argue the importance of identifying the practical characteristics of edge-cloud data transmission at runtime, because the data transmission characteristics can vary considerably over both different workload regimes and different environmental conditions. For example, by intuitively assuming the network congestion due to big data volumes, some researchers propose to prioritize the health data traffic, which however would incur unnecessary processing delay and result in unwanted unfairness among patients in the context of our project [45–47].
Furthermore, considering the usually heterogeneous capacity of upload bandwidth and uneven request rates from different edge nodes [48], we also use this limit to argue the necessity of replicating the characterization implementation rather than simply reusing the previous characterization results in different situations. In other words, we claim that there is no one-size-fits-all latency inequality system to improve the time efficiency in edge-cloud data transmissions. Practitioners should empirically build up specific latency inequality systems for different applications at different relay nodes, by referring to the logic and process of the experimental investigation and modeling analysis reported in this paper as the generic methodology.
2) Data-type-specific Buffering Technique.
Recall that the Firebase Storage in our testbed only allows uploading one single file per communication transaction. We also tried zipping as an alternative buffering mechanism besides the PDF-file merging. Although we observed similar buffering latency, zipping-aided transmission generally transferred bigger-size data than merging-aided transmission, as exemplified in Table 7. The smaller data size in the latter case is mainly because n−1 file headers are saved after merging n PDF files into one. Therefore, we decided to take advantage of the specific data type (i.e. PDF) to save communication overhead in practice. Note that “buffering by grouping” in Table 7 is only to sum up the sizes of individual PDF files for theoretical comparison, while it is not a functional technique on our testbed.
This limit further confirms that the practical characteristics of edge-cloud data transmission can be impacted by many factors. Thus, we urge including empirical characterization in any research on optimizing edge-cloud communication. It is noteworthy that, although employing a different buffering technique (e.g., zipping) would change the quantitative parameters in the inequality system, the qualitative logic and methodology of our study will still be valid and remain the same.
Conclusions and future work
Backbone buffers have been deployed across the entire Internet, in order to help transport protocols and algorithms maximize network throughput, minimize communication delay, and reduce data loss. These infrastructure-level buffering implementations can be viewed as public services for the universal data packet transmissions, without necessarily being dedicated to individual applications. When it comes to the application level, there might be requirements of application-specific buffering mechanisms with dedicated buffers. For example, applications dealing with sparse and small-size data units can use buffers to enhance their communication energy efficiency; while applications having periodic data flood can use buffers to avoid potential communication congestion. It is notable that, no matter working on infrastructure or application, the existing studies generally trade off data transmission time in exchange for other benefits when utilizing buffers.
Given the requirement of processing and transmitting small-size atomic data entities in our edge cloud computing project, we started wondering if employing buffers could eventually reduce the system’s communication latency, besides those trade-off benefits. Thus, we defined two research questions and developed a testbed to investigate the feasibility and effectiveness of using buffers to speed up data transmission.
Current findings
By answering YES to the first research question, we are able to conclude the existence of chances in improving time efficiency of edge-cloud communication. Note this conclusion does not violate the existing lessons that buffers will introduce additional delay to the communication, because our argument is to slow down a small part for speeding up the whole.
After pursuing answers to the second research question, we conclude that the applicability of buffering should be a mandatory concern when developing edge cloud applications, because the buffering mechanism may significantly improve the communication performance under suitable circumstances. The applicable circumstances can be determined via an empirical latency inequality system derived from a full cycle of experimental investigation and modeling analysis. Since the quantitative speedup would vary when workload regimes and environmental conditions are different, in practice, we suggest using the second research question to drive replicated investigations and explore application-specific answers case by case.
Future work
Driven by both the findings and the limits of the current work, we plan to gradually involve extra factors and continue this research along three directions in the future. This incremental research strategy essentially follows the experimental principle of gradual factorial investigations [38].
-
Varying atomic data entities at relay nodes. Due to the nature of the same-format prediagnosis reports, the buffered objects in this research are homogeneous atomic data entities with roughly the same data size. Considering that there must be different transmission patterns with regarding to heterogeneous data entities, we will employ mixed-data application scenarios and re-investigate the time efficiency of buffer-aided relaying in this case. It should be noted that the mixed-data scenario among multiple applications is out of the scope if this research direction. As clarified previously, the application-level buffering is supposed to be programmatically controllable within the application’s implementation.
-
Multi-thread data processing at relay nodes. As justified in “Experimental analysis of FIFS transmission” section, our current work is only focused on the single-thread data processing at relay nodes, so as to make this study compatible with the diverse compute capacities of heterogeneous edge devices. Based on such a fundamental study, we will narrow down our focus to the edge devices with multi-thread processing capacities, and investigate buffer-aided relaying for intensive and simultaneous tasks in edge cloud applications.
-
Multi-objective buffering at relay nodes. Using a latency inequality system has been able to reveal the maximum gains for the whole “team” of the buffered data when delaying particular atomic data entities. However, it could be unclear about delaying which ones for the team at runtime. Therefore, we will take into account multiple objectives of buffer-aided relaying to optimally decide when to stop buffering, for example, by including the different priorities and/or a delay penalty function for the individual atomic data entities. It is foreseeable that the development and validation of potential optimization policies will require extensive empirical investigations. Thus, the methodology demonstrated in this research can act as a solid cornerstone to significantly facilitate future investigations.
Availability of data and materials
The mobile app developed in this research is open-sourced at https://github.com/Frmillar/NutriEvaluator
The 50 example prediagnosis reports generated on the testbed are shared online at http://doi.org/10.5281/zenodo.4556465
Notes
The mobile app is open-sourced at https://github.com/Frmillar/NutriEvaluator
An example report is shared online: https://bit.ly/2UE8CA7
The 50 reports are shared online: http://doi.org/10.5281/zenodo.4556465
Abbreviations
- DOE:
-
Design of Experiments
- ECG:
-
electrocardiography
- FIFS:
-
First-In-First- Served
- JSON:
-
JavaScript Object Notation
- PDF:
-
Portable Document Format
- RQ:
-
Research Question
References
Tanenbaum AS, van Steen M (2006) Distributed Systems: Principles and Paradigms, 2nd, 115.. Prentice Hall, Upper Saddle River, NJ.
Amin O, Mesleh R, Ikki SS, Ahmed MH, Dobre OA (2015) Performance analysis of multiple relays cooperative systems with signal space diversity. IEEE Trans Veh Technol 64(8):3414–3425. https://doi.org/10.1109/TVT.2014.2359175.
Tao X, Xu X, Cui Q (2012) An overview of cooperative communications. IEEE Commun Mag 50(6):65–71. https://doi.org/10.1109/MCOM.2012.6211487.
Alipio M, Tiglao NM, Grilo A, Bokhari F, Chaudhry U, Qureshi S (2017) Cache-based transport protocols in wireless sensor networks: A survey and future directions. J Netw Comput Appl 88:29–49. https://doi.org/10.1016/j.jnca.2017.04.001.
Zlatanov N, Ikhlef A, Islam T, Schober R (2014) Buffer-aided cooperative communications: Opportunities and challenges. IEEE Commun Mag 52(4):146–153. https://doi.org/10.1109/MCOM.2014.6807959.
Gettys J, Nichols K (2012) Bufferbloat: Dark buffers in the internet. Commun ACM 55(1):57–65. https://doi.org/10.1145/2063176.2063196.
Wolfson O, Xu B, Tanner RM (2007) Mobile peer-to-peer data dissemination with resource constraints In: Proceedings of the 8th International Conference on Mobile Data Management (MDM 2007), 16–23.. IEEE Press, Mannheim, Germany. https://doi.org/10.1109/MDM.2007.12.
Ma L, Xu Y, Sun J, Huang W, Xie S, Li Y, Liu N (2018) Buffer control in VR video transmission over MMT system In: Proceedings of the 13th IEEE International Symposium on Broadband Multimedia Systems and Broadcasting (BMSB 2018), 1–5.. IEEE Press, Valencia, Spain. https://doi.org/10.1109/BMSB.2018.8436817.
Qiao D, Gursoy MC (2017) Buffer-aided relay systems under delay constraints: Potentials and challenges. IEEE Commun Mag 55(9):168–174. https://doi.org/10.1109/MCOM.2017.1600213.
Shpiner A, Zahavi E (2016) Race cars vs. trailer trucks: Switch buffers sizing vs. latency trade-offs in data center networks In: Proceedings of the IEEE 24th Annual Symposium on High-Performance Interconnects (HOTI 2016), 53–59.. IEEE Computer Society, Santa Clara, CA, USA. https://doi.org/10.1109/HOTI.2016.021.
Jawadekar WS (2009) Management Information Systems: Text & Cases, 4th, 520.. Tata Mcgraw Hil, l7 West Patel Nagar, New Delhi.
Zlatanov N, Schober R (2013) Buffer-aided relaying with adaptive link selection–fixed and mixed rate transmission. IEEE Trans Inf Theory 59(5):2816–2840. https://doi.org/10.1109/TIT.2013.2238607.
Li Z, Millar-Bilbao F (2020) Characterising edge-cloud data transmission for patient-centric healthcare systems In: Proceedings of the 22nd IEEE International Conference on E-health Networking, Application & Services (HealthCom 2020).. IEEE Communications Society, Shenzhen, China. to appear.
Kim J-H, Lee S-H, Jin H-W (2016) Supporting virtualization standard for network devices in RTEMS real-time operating system. ACM SIGBED Rev 13(1):35–40. https://doi.org/10.1145/2907972.2907977.
Söderman P, Grinnemo K-J, Hidell M, Sjödin P (2015) EWSN 2015: Wireless Sensor Networks. In: Abdelzaher T, Pereira N, Tovar E (eds)Lecture Notes in Computer Science, 104–119.. Springer, Cham. https://doi.org/10.1007/978-3-319-15582-1_7.
Wang H, Crilly B, Zhao W, Autry C, Swank S (2007) Implementing mobile ad hoc networking (MANET) over legacy tactical radio links In: Proceedings of the 26th IEEE Military Communications Conference (MILCOM 2007), 1–7.. IEEE Press, Orlando, FL, USA. https://doi.org/10.1109/MILCOM.2007.4455103.
Chen S, Yang N (2006) Congestion avoidance based on lightweight buffer management in sensor networks. IEEE Trans Parallel Distrib Syst 17(9):934–946. https://doi.org/10.1109/TPDS.2006.115.
Cao L, Settlemyer BW, Bent J (2017) To share or not to share: Comparing burst buffer architectures In: Proceedings of the 25th High Performance Computing Symposium (HPC 2017).. Society for Computer Simulation International, Virginia Beach, VA, USA. https://dl.acm.org/doi/10.5555/3108096.3108100.
Ghasemzadeh H, Loseu V, Ostadabbas S, Jafari R (2010) Burst communication by means of buffer allocation in body sensor networks: Exploiting signal processing to reduce the number of transmissions. IEEE J Sel Areas Commun 28(7):1073–1082. https://doi.org/10.1109/JSAC.2010.100912.
Maheswar R, Jayarajan P, Vimalraj S, Sivagnanam G, Sivasankaran V, Amiri IS (2018) Energy efficient real time environmental monitoring system using buffer management protocol In: Proceedings of the 9th International Conference on Computing, Communication and Networking Technologies (ICCCNT 2018), 1–5.. IEEE Press, Bangalore, India. https://doi.org/10.1109/ICCCNT.2018.8494144.
Fang J, Ma A (2021) IoT application modules placement and dynamic task processing in edge-cloud computing. Internet Things J I. https://doi.org/10.1109/JIOT.2020.3007751, https://ieeexplore.ieee.org/document/9134385.
Tianfield H (2018) Towards edge-cloud computing In: Proceedings of the 2018 IEEE International Conference on Big Data (BigData 2018), 4883–4885.. IEEE Press, Seattle, WA, USA. https://doi.org/10.1109/BigData.2018.8622052.
Villari M, Fazio M, Dustdar S, Rana O, Ranjan R (2016) Osmotic computing: A new paradigm for edge/cloud integration. IEEE Cloud Comput 3(6):76–83. https://doi.org/10.1109/MCC.2016.124.
Luo S, Teh KC (2017) Adaptive transmission for cooperative NOMA system with buffer-aided relaying. IEEE Commun Lett 21(4):937–940. https://doi.org/10.1109/LCOMM.2016.2647250.
Huang J, Swindlehurst AL (2015) Buffer-aided relaying for two-hop secure communication. IEEE Trans Wirel Commun 14(1):152–146. https://doi.org/10.1109/TWC.2014.2334602.
Kim SM, Seo S, Jang SK, Kim J (2018) On the buffer-aided relaying technique and its applications. Int J Appl Eng Res 13(2):1514–1519. https://www.ripublication.com/ijaer18/ijaerv13n2_93.pdf.
Wen C, Yeh M-F, Chang K-C, Lee R-G (2008) Real-time ECG telemonitoring system design with mobile phone platform. Meas 41(4):463–470. https://doi.org/10.1016/j.measurement.2006.12.006.
Chou C-Y, Chang E-J, Li H-T, Wu A-Y (2018) Low-complexity privacy-preserving compressive analysis using subspace-based dictionary for ECG telemonitoring system. IEEE Trans Biomed Circ Syst 12(4):801–811. https://doi.org/10.1109/TBCAS.2018.2828031.
Wang X, Gui Q, Liu B, Jin Z, Chen Y (2014) Enabling smart personalized healthcare: A hybrid mobile-cloud approach for ECG telemonitoring. IEEE J Biomed Health Inform 18(3):739–745. https://doi.org/10.1109/JBHI.2013.2286157.
Engin M, Çağlav E, Engin EZ (2005) Real-time ECG signal transmission via telephone network. Meas 37(2):167–171. https://doi.org/10.1016/j.measurement.2004.11.001.
Shu P, Liu F, Jin H, Chen M, Wen F, Qu Y, Li B (2013) eTime: Energy-efficient transmission between cloud and mobile devices In: Proceedings of The 32nd IEEE International Conference on Computer Communications (IEEE INFOCOM 2013), 195–199.. IEEE Press, Turin, Italy. https://doi.org/10.1109/INFCOM.2013.6566762.
Jiang Z, Zhang X, Huang W, Chen H, Xu Y, Hwang J-N, Ma Z, Sun J (2020) A hierarchical buffer management approach to rate adaptation for 360-degree video streaming. IEEE Trans Veh Technol 69(2):2157–2170. https://doi.org/10.1109/TVT.2019.2960866.
Demircin MU, van Beek PJL (2010) Sender-side Bandwidth Estimation for Video Transmission with Receiver Packet Buffer. Patent: US7784076B2. https://patents.google.com/patent/US7784076.
Harumoto H, Horiuchi M, Fujita T (2006) System for transmitting stream data from server to client based on buffer and transmission capacities and delay time of the client. Patent: US7016970B2. https://patents.google.com/patent/US7016970B2/en.
Domenico MD, Solé-Ribalta A, Cozzo E, Kivelä M, Moreno Y, Porter MA, Gómez S, Arenas A (2013) Mathematical formulation of multilayer networks. Phys Rev X 3(4):041022. https://doi.org/10.1103/PhysRevX.3.041022.
Li Z, O’Brien L, Zhang H, Cai R (2014) On the conceptualization of performance evaluation of IaaS services. IEEE Trans Serv Comput 7(4):628–641. https://doi.org/10.1109/TSC.2013.39.
Obaidat MS, Boudriga NA (2010) Fundamentals of Performance Evaluation of Computer and Telecommjnication Systems, 8.. John Wiley & Sons, Inc., Hoboken.
Montgomery DC (2019) Design and Analysis of Experiments, 9th, 162–165.. John Wiley & Sons, Inc., Hoboken.
Augusto JC (2010) Agents and Artificial Intelligence. In: Filipe J, Fred A, Sharp B (eds)Communications in Computer and Information Science, 3–15.. Springer, Berlin. https://doi.org/10.1007/978-3-642-11819-7_1.
Viani F, Robol F, Polo A, Rocca P, Oliveri G, Massa A (2013) Wireless architectures for heterogeneous sensing in smart home applications: Concepts and real implementation. Proc IEEE 101(11):2381–2396. https://doi.org/10.1109/JPROC.2013.2266858.
Writer S (2020) What is a model in science?https://www.reference.com/science/model-science-727cde390380e207.
Mellor SJ, Clark AN, Futagami T (2003) Model-driven development – guest editor’s introduction. IEEE Softw 20(5):14–18. https://doi.org/10.1109/MS.2003.1231145.
Jenkins DG, Quintana-Ascencio PF (2020) A solution to minimum sample size for regressions. PLoS ONE 15(2):0229345. https://doi.org/10.1371/journal.pone.0229345.
Mogul JC, Minshall G (2001) Rethinking the TCP nagle algorithm. ACM SIGCOMM Comput Commun Rev 31(1):6–20. https://doi.org/10.1145/382176.382177.
Beitelspacher S, Mubashir M, Besher KM, Ali MZ (2020) Prioritizing health care data traffic in a congested IoT cloud network In: Proceedings of the 2020 IEEE Wireless Communications and Networking Conference Workshops (WCNCW), 1–6.. IEEE Press, Seoul, South Korea. https://doi.org/10.1109/WCNCW48565.2020.9124867.
Kumar MA, Vimala R, Britto KRA (2019) A cognitive technology based healthcare monitoring system and medical data transmission. Meas 146:322–332. https://doi.org/10.1016/j.measurement.2019.03.017.
Misra S, Chatterjee S (2014) Social choice considerations in cloud-assisted WBAN architecture for post-disaster healthcare: Data aggregation and channelization. Inf Sci 284:95–117. https://doi.org/10.1016/j.ins.2014.05.010.
Zhao W, Liu J, Guo H, Hara T (2018) ETC-IoT: Edge-node-assisted transmitting for the cloud-centric internet of things. IEEE Netw 32(3):101–107. https://doi.org/10.1109/MNET.2018.1700164.
Acknowledgements
We acknowledge the thorough reviews, insightful comments and helpful suggestions from the editors and the reviewers.
Funding
This work is supported in part by Chilean National Research and Development Agency (ANID, Chile) [grant FONDECYT Iniciación 11180905], and by MICINN-AEI (PGE and ERDF) [grants RTC-2017-5908-7,PID2019-105221RB-C41] and by Xunta de Galicia (co-founded by ERDF) [grant ED431C 2017/58]. We also wish to acknowledge the support received from the Centro de Investigación de Galicia “CITIC”, funded by Xunta de Galicia and the European Union (European Regional Development Fund – Galicia 2014-2020 Program), by grant ED431G 2019/01.
Author information
Authors and Affiliations
Contributions
Authors’ contributions
All authors took part in the discussion and analysis of the work described in this paper. Francisco Millar-Bilbao led the experiments. Zheng Li led the writing of this paper. All authors read and approved the final manuscript.
Authors’ information
Zheng Li is an assistant professor at the Department of Computer Science, University of Concepción. Francisco Millar-Bilbao is a research student at the Department of Computer Science, University of Concepción. Gonzalo Rojas-Durán is an assistant professor at the Department of Computer Science, University of Concepción. Susana Ladra is an associate professor at Universidade da Coruña, CITIC.
Corresponding author
Ethics declarations
Competing interests
The authors declare that they have no competing interests.
Additional information
Publisher’s Note
Springer Nature remains neutral with regard to jurisdictional claims in published maps and institutional affiliations.
Rights and permissions
Open Access This article is licensed under a Creative Commons Attribution 4.0 International License, which permits use, sharing, adaptation, distribution and reproduction in any medium or format, as long as you give appropriate credit to the original author(s) and the source, provide a link to the Creative Commons licence, and indicate if changes were made. The images or other third party material in this article are included in the article’s Creative Commons licence, unless indicated otherwise in a credit line to the material. If material is not included in the article’s Creative Commons licence and your intended use is not permitted by statutory regulation or exceeds the permitted use, you will need to obtain permission directly from the copyright holder. To view a copy of this licence, visit http://creativecommons.org/licenses/by/4.0/.
About this article

Cite this article
Li, Z., Millar-Bilbao, F., Rojas-Durán, G. et al. Take one for the team: on the time efficiency of application-level buffer-aided relaying in edge cloud communication. J Cloud Comp 10, 24 (2021). https://doi.org/10.1186/s13677-021-00241-x
Received:
Accepted:
Published:
DOI: https://doi.org/10.1186/s13677-021-00241-x