- Research
- Open access
- Published:
Optimal cloud assistance policy of end-edge-cloud ecosystem for mitigating edge distributed denial of service attacks
Journal of Cloud Computing volume 10, Article number: 42 (2021)
Abstract
Edge computing has become a fundamental technology for Internet of Things (IoT) applications. To provide reliable services for latency-sensitive applications, edge servers must respond to end devices within the shortest amount of time possible. Edge distributed denial-of-service (DDoS) attacks, which render edge servers unusable by legitimate IoT applications by sending heavy requests from distributed attacking sources, is a threat that leads to severe latency. To protect edge servers from DDoS attacks, a hybrid computing paradigm known as an end-edge-cloud ecosystem provides a possible solution. Cloud assistance is allowed with this architecture. Edge servers can upload their pending tasks onto a cloud center for a workload reduction when encountering a DDoS attack, similar to borrowing resources from the cloud. Nevertheless, before using the ecosystem to mitigate edge DDoS attacks, we must address the core problem that edge servers must decide when and to what extent they should upload tasks to the cloud center. In this study, we focus on the design of optimal cloud assistance policies. First, we propose an edge workload evolution model that describes how the workload of the edge servers change over time with a given cloud assistance policy. On this basis, we quantify the effectiveness of the policy by using the resulting overall latency and formulate an optimal control problem for seeking optimal policies that can minimize such latency. We then provide solutions by deriving the optimality system and discuss some properties of the optimal solutions to accelerate the problem solving. Next, we introduce a numerical iterative algorithm to seek solutions that can satisfy the optimality system. Finally, we provide several illustrative numerical examples. The results show that the optimal policies obtained can effectively mitigate edge DDoS attacks.
Introduction
With the development of microcomputer technology, Internet-of-Things (IoT) devices have been widely deployed for data collection [1, 2]. However, IoT devices have difficulty supporting resource-intensive applications owing to energy and computational constraints. To tackle this issue, edge computing [3, 4], a computation paradigm that allows IoT tasks to be processed at the edge of the Internet, has been proposed for efficient computation offloading. In recent years, this technology has been applied to various applications, including smart grids [5], connected health [6], and connected automated vehicles [7].
Because edge computing has become a fundamental technology for IoT applications, and edge servers (ESs) must have strong security for providing reliable services. Among common cyber threats to ESs, distributed denial-of-service (DDoS) attacks [8, 9] can lead to severe results. As the name suggests, a DDoS attack renders ESs unusable by legitimate IoT applications by sending heavy resource-consuming requests from distributed attacking sources. Because of the inherent vulnerabilities of IoT devices [10–12], attackers can infect numerous IoT devices without much effort and offload heavy tasks onto the ESs. Consequently, the ESs will likely crash, and the response time of the computation tasks will become too long to ensure reliable services for latency-sensitive applications. For convenience, we refer to this type of attack as an edge DDoS attack. Figure 1 shows a diagram of the relevant scenario. Therefore, defending against edge DDoS attacks has become an essential issue in the field of edge computing [13, 14].

A scenario of edge DDoS attacks
Motivation
To mitigate edge DDoS attacks, a hybrid computing paradigm known as an end-edge-cloud (EEC) ecosystem [15–18] provides a possible solution, converging the designs of cloud [19, 20] and edge [3, 4] computing. As shown in Fig. 2, such an ecosystem includes a super-capacity cloud center, numerous constrained-capacity ESs, and a large number of low-capacity end devices. Computation tasks produced by the end side are processed at either the edge or cloud side. The workflow can be described as follows: First, IoT tasks arrive at a local access point (AP) that connects the end and edge sides. Then, with the control of a load balance scheme, the local AP dispatches these tasks within the interconnecting network of the ESs. Next, at an ES, some arriving tasks will be processed immediately, whereas some will have to wait for computational resources. If the resources of an ES are insufficient, the ES can proactively outsource a portion of pending tasks onto the cloud center, similar to borrowing resources from the cloud side. Under this mechanism, if an edge DDoS attack occurs, the cloud side will act as an emergency resource to relieve the workload of the edge.

A diagram of how an EEC ecosystem can mitigate an edge DDoS attack. The DDoS traffic, on the one hand, will be distributed among local edge servers owing to the load balancer, on the other hand, will be uploaded onto the cloud center owing to the cloud assistance mechanism
Nevertheless, before implementing the above blueprint, we must address the core problem, namely, when and to what extent an ES should upload its pending tasks onto the cloud center, thereby minimizing the impact caused by DDoS attacks. We refer to this as the cloud assistance (CA) problem, and refer to any solution as the CA policy. Solving the CA problem is complex. On the one hand, with the constrained resource of an ES, a lower assistance level will result in a higher computational latency; on the other hand, because the bandwidth is a bottleneck of the network core, a higher assistance level will result in a higher communication latency. To provide reliable services, ESs must respond to the end devices within the shortest possible time. Therefore, an effective CA policy should account for both computation and communication delays and minimize the overall latency.
Contributions
In this study, a design for using the EEC ecosystem to mitigate edge DDoS attacks was developed. In particular, we address the CA problem. Our contributions are as follows:
-
We propose a novel dynamic edge workload model that incorporates the changing workload of the ESs under the effects of a DDoS attack, a load balance scheme, and a CA policy. On this basis, we evaluate the effectiveness of the CA policy by quantifying the resulting overall latency, which consists of computation and communication delays. Then, to seek optimal CA policies, we formulate an optimal control problem, where a solution represents a policy and the objective functional stands for the resulting overall latency.
-
Based on Pontryagin’s minimum principle [21], we derive the optimality system for solving the formulated optimal control problem, which provides a set of necessary optimality conditions. To accelerate the problem solving, we then discuss some properties of the optimal solutions. To solve the problem numerically, we introduce an iterative algorithm based on the forward-backward sweep method [22] to find possible optimal solutions that satisfy the optimality system.
-
We provide several numerical examples to illustrate the optimal CA policies. The results show that the optimal policies obtained can effectively mitigate the impact of DDoS attacks.
The remainder of this paper is organized as follows. “Related work” section reviews related studies and outlines our innovations. “System modeling and problem formulation” section is devoted to system modeling and problem formulation. “Solution” section focuses on solutions. Several numerical examples are provided in “Illustrative examples” section. The remainder of this paper is organized as “Conclusion” section.
Related work
In this section, we discuss related studies and outline our innovations. First, we review the efforts to mitigate DDoS attacks. Second, we discuss the relationship between our modeling approach and previous research on computing offloading modeling.
Mitigation of DDoS attacks
A DDoS attack refers to any type of malicious operation that renders a server unusable by sending resource-consuming requests. There are two major mitigation approaches.
The first approach is devoted to the detection and elimination of malicious requests. Researchers in this field believe that there must be some differences between normal and malicious operations. On this basis, they analyzed the features of different types of attacks and developed corresponding protective methods, including behavior-based approaches [23–25] for detecting abnormal request sequences, traffic-based methods [26, 27] for detecting abnormal data flows, and request-based methods [28–30] for detecting abnormal packets. However, the detectability of malicious requests remains to be confirmed because it is difficult to determine whether a sophisticated attack can forge malicious requests that are extremely similar to the normal request. In fact, it was shown that bots can forge the behaviors of human users and break some commonly used security protections with the aid of artificial intelligence technology [31–34]. Therefore, detection-based methods seem to require more fault tolerance to defend against advanced DDoS attacks.
The other approach, which does not have to rely on the detectability of malicious requests and hence has a good fault tolerance for protecting against general DDoS attacks, is to absorb the high-volume attacking traffic with larger-capacity machines. We refer to this as a capacity-based approach. An important technique in this field is to use the content delivery network (CDN) as an emergency resource to handle malicious operations [35–39]. When an attack occurs, idle CDN nodes copy the required static contents as a cache from the origin ES and use the cache to help respond to malicious requests, without regard to the attack detail. With this universality, the CDN-based method has become a popular commercial solution for DDoS attack mitigation. However, when the attack is designed to request different dynamic contents, the CDN will have to continuously copy related content from the origin ES. In this case, the origin of the ES workload cannot be effectively reduced.
The use of an EEC ecosystem to mitigate edge DDoS attacks is a possible solution that follows the capacity-based approach. With this method, a super-capacity cloud center is used as an emergency resource to help handle enormous malicious requests on the edge side. Unlike the CDN-based method, the ecosystem is a distributed cluster in which any single component can function as an independent origin server. Hence, when malicious requests are distinct or dynamic, the ecosystem can protect ESs using cloud resources. However, there are no references that can inform the design of related policies for implementation, and the CA problem remains to be solved.
In this paper, we focus on the design of effective CA policies that will help develop the design of an ecosystem to mitigate edge DDoS attacks. To the best of our knowledge, this is the first study to make such an attempt.
Relations between our modeling approach and computing offloading models
A computing offloading problem is about how to upload the tasks generated from the end side onto the edge or cloud side.
A common methodology to address edge computing offloading problems includes the following three steps. First, specify a static controllable decision variable. Second, formulate a set of performance indice (e.g., the energy consumption) for the static decision variable, and reduce a computing offloading problem as a programming problem (e.g., the nonlinear mixed integer programming problem). Third, investigate the properties of the assignment problem and design a new algorithm with the properties. See [40–42] for certain examples. For convenience, we refer to all the computing offloading models of this methodology as the static offloading models. In a static offloading model, the decision variable will not change over time, and the offloading process is usually considered to be an instantaneous event. Static offloading models are not suitable for the study of DDoS mitigation, because a DDoS attack usually takes palce over a long period.
Some studies consider the dynamic process of computing offloading. See [43–47] for certain examples. We refer to all the related models as the dynamic offloading models. In a dynamic offloading model, new tasks will be continuously generated from the end side over time. Accordingly, the decision variable is a sequence of time, and the change of the decision variable will lead to the evolution of the offloading process. Our modeling approach is similar to the dynamic offloading modeling technique, because a DDoS attack can be also regarded as a large-scale task concurrent from the perspective of computing offloading.
However, to our best knowledge, existing dynamic offloading models can not be directly applied in our study. There are two reasons. First, load balance is an important part of an EEC ecosystem, but the influence of different load balance schemes is seldom considered in offloading models. Second, we can hardly see any dynamic offloading model that characterizes the cloud assistance process of an EEC ecosystem. Therefore, we have to propose a novel workload evolution model.
System modeling and problem formulation
In this section, we are devoted to designing an effective CA policy for mitigating edge DDoS attacks. First, in order to capture the effect of CA policies, we propose a novel workload evolution model for ESs, accounting for different load balance schemes applied to the edge computing network. Second, we quantify the overall latency caused by computation and communication delays. Then, we formulate an optimal control problem for seeking optimal policies.
A evolution model of edge workload distribution
Let us start by introducing some notations. As we mentioned before, the core of an EEC ecosystem consists of a distributed edge computing network and a cloud center. Suppose that the edge network is composed of M ESs, each of which has a unique ID labeled by \(s_{1},s_{2},\dots,s_{M}\). Because load balance is available in the network, we need to model the relations among all ESs in terms of computation forwarding. Let \(S=\{s_{1},s_{2},\dots,s_{M}\}\) denote the set of all ESs. Denote by eij the edge from si to sj if server si is able to forward its computation tasks to server sj. Let E be the set of all such logical edges. Then, we use a graph G=(S,E) to represent the computation forwarding relations among ESs. For convenience, denote by AM×M the adjacency matrix of G, where Aij=1 or 0 according to whether eij∈E or not. In particular, let Aii=0 for all \(i=1,2,\dots,M\). Also, we define a modified matrix BM×M where Bij=Aij,i≠j, and \(B_{{ii}}=1, i=1,2,\dots,M\).
Consider a small time horizon t∈[0,T], in which a developed policy makes effect. On measuring the impact of an DDoS attack, we denote by αi(t) the increase rate of new computation tasks, which can be obtained by estimation or prediction with the help of historical data. Suppose that each ES has a infinite-length task queue, and denote by wi(t)∈[0,∞] the workload of server si at time t. We refer to the M-dim function \(w(t)=(w_{1}(t),w_{2}(t),\dots,w_{M}(t)), 0 \le t \le T\), as the workload distribution of the edge computing network. Denote by ui(t)∈[0,1] the related assistance rate at time t, which controls the proportion of pending tasks that will be transferred from server si to the cloud. Then, the CA policy is represented by the M-dim function \(u(t)=(u_{1}(t),u_{2}(t),\dots,u_{M}(t))\). Assume that all CA policies are Lebesgue integrable, and let Ω be the set of all Lebesgue integrable functions defined on the time horizon [0,T], whose value space at any time is [0,1]M. Then, we refer to Ω as the admissible set of CA policies. Accounting for the influence of load balance, we denote by fij(t)∈[0,1] the computation forwarding ratio at time t, which represents the proportion of pending tasks that will be transferred from server si to sj, provided that load balance is available between the two ESs. Because of computation conservation, we have \(\sum _{j=1}^{M} B_{{ij}} f_{{ij}}(t) = 1\) for any time t.
Next, we need to model how the workload distribution will evolves over time under a given CA policy. According to the workflow of the EEC ecosystem, the workload of an ES can be affected by three factors: (a) the computation increase due to the DDoS attack, (b) the computation forwarding due to the load balance scheme, and (c) the computation offloading due to the cloud assistance. On the one hand, the workload of a server would increase due to receiving new computation tasks from end devices and peer ESs. On the other hand, the workload of a server would decrease due to uploading computation tasks to the cloud. The following theorem provides the dynamic system of the workload distribution.
Theorem 1
The workload distribution w(t) evolves according to the following dynamic system:
where w0∈RM represents the initial workload distribution.
Proof
Let Δt be a variation of time. For any time t,
-
Due to the computation increase of the locality, the workload of si increases at the rate of αi(t);
-
Due to the computation receiving from other servers, the workload of si increases at the rate of \(\sum _{j=1}^{M} A_{{ji}} f_{{ji}}(t) \alpha _{j}(t)\);
-
Due to the computation forwarding to other servers, the workload of si decreases at the rate \(\alpha _{i}(t) \sum _{j=1}^{M} A_{{ij}} f_{{ij}}(t)\);
-
Due to cloud assistance, the workload of si decreases at the rate of wi(t)ui(t).
Therefore, it follows that
As \(\sum _{j=1}^{M} B_{{ij}} f_{{ij}}(t) = 1\), we have
The proof is completed. □
With this dynamic system, we can predict the workload of any server at any time, which provides the foundation for quantifying the overall latency caused by a specific CA policy. We refer to this dynamic system as the workload distribution evolution model, also short for the workload model.
Examples of load balance schemes
In the previous subsection, we proposed a workload model for capturing the workload distribution dynamics of the distributed edge computing system, where we denoted by the function f the computation forwarding ratio that represents the influence of different load balance schemes. In this subsection, we give examples of charactering such type of functions.
In the first example, we consider the Round Robin scheme [48], one of the most commonly-used load balance algorithms. In the RR scheme, a controller equally dispatches newly-received computation tasks among ESs in spite of their current workload distribution. The forwarding ratio from server si to sj can be expressed as
In the second example, we consider the Least Connection scheme [49]. Different from the RR scheme, the LC scheme takes into account the current workload distribution of ESs. Among all servers, the one that is with a higher workload will receive fewer tasks; on the contrary, the one that is with a lower workload will receive more tasks, so that the workload of each server can be maintained at the same level as much as possible. The forwarding ratio from server si to sj can be expressed as
As the workload of a server can be zero, let ε be a small number and let the function fij be approximated as
An optimal control problem
In the previous subsections, we proposed a workload model and gave some examples of charactering different load balance schemes. In this subsection, we are devoted to formulating an optimal control problem for seeking optimal CA policies.
First, we need to quantify the overall latency caused by a given CA policy. In practice, as we assume that the cloud is capability-infinite, the overall latency comes from three parts: (a) the communication latency of cloud assistance, (b) the communication latency of edge load balance, and (c) the computation latency of edge computing.
First, suppose that at any time the communication delay of transferring z computation tasks from the edge to the cloud increases at the rate h(z). Then, given the initial workload distribution w0 and the CA policy u(t), the expected total communication delay of transferring tasks from the edge to the cloud during the time horizon [0,T] is
Second, as all computation forwarding is one-hop, the total communication delay among ESs is determined by the number of forwarded tasks. Let dij be the average delay of forwarding one task from server si to sj. Note that the task forwarding from si to sj and that from sj to si can not be offset. Then, given the initial workload distribution w0 and the CA policy u(t), the expected total communication delay of forwarding tasks among ESs during the time horizon [0,T] is
Third, let g(z) denote the overall computation delay per unit time when the workload of a server is z, where g is an increasing function of z and g(0)=0. Then, given the initial workload distribution w0 and the CA policy u(t), the expected total computation delay at the edge is
To summarize, given the initial workload distribution w0, the overall latency caused by the CA policy u(t) is
For convenience, let the utility function be
The goal of this paper is to find an optimal dynamic CA policy u∈Ω with the constrain of the proposed workload model (1), so that the overall latency J is minimized. Therefore, we can formulate an optimal control problem as follows.
For convenience, we refer to this optimal control problem as the Optimal Cloud Assistance problem.
Solution
In the previous subsection, we formulated an continuous-time optimal control problem (12) for seeking optimal CA policies, so that the overall latency is minimized. In this subsection, we now move on to solving the formulated optimal control problem.
As the problem is time-continuous, Pontryagin Minimum Principle [21] provides an effective approach to solving it. As an outline, Pontryagin Minimum Principle gives a set of necessary conditions for optimal solutions to an optimal control problem, which we refer to as the optimality system. By solving the system, we are able to find the most likely ones to be optimal controls. To find controls that satisfy all the necessary conditions in the optimality system, we apply an iterative algorithm known as the Forward-Backward Sweep Method [22]. Finally, we recommend the obtained optimal solution as an optimal CA policy.
Optimality system
Let us discuss the necessary conditions of optimal solutions. We begin by formulating the Hamiltonian function for the collaborative offloading problem (12).
where \(p=(p_{1},\dots,p_{M})^{T}\) is the adjoint vector of the Hamiltonian function.
Denote by u(t)∈Ω an optimal control, w(t) the associated workload distribution, and p(t) the associated adjoint function. Then, combining the statement in Pontryagin Minimum Principle, we give the following theorem that shows a set of necessary conditions to optimal controls.
Theorem 2
The optimal control u(t), optimal workload distribution trajectory w(t), and adjoint function p(t) must satisfy the following two conditions simultaneously.
-
1
The optimal control u(t) must meet the condition that
$$ \begin{aligned} u_{i}(t) = \arg\min_{z\in[0,1]} \ h(z w_{i}) - p_{i} w_{i} z, \quad 0 \le t \le T, \ i = 1,2,\dots,M; \end{aligned} $$(14) -
2
The optimal workload distribution trajectory w(t) evolves according to the workload model (1), and adjoint function p(t) evolves according to
$$ \left\{ \begin{aligned} \dot{p}_{i}(t) & =[p_{i}(t) \! - \! h^{\prime}(u_{i}(t)w_{i}(t))] u_{i}(t) - g'(w_{i}(t)) \!\\&\quad- \! \sum_{j=1}^{M} p_{j}(t) \alpha_{j}(t) \frac{\partial f_{{jj}}}{\partial w_{i}}(t) \\ & \quad- \sum_{j=1}^{M} \sum_{k=1}^{M} A_{{jk}} \alpha_{j}(t) d_{{jk}} \frac{\partial f_{{jk}}}{\partial w_{i}}(t) \\&\quad- \sum_{j=1}^{M} p_{j}(t) \sum_{k=1}^{M} A_{{kj}} \alpha_{k}(t) \frac{\partial f_{{kj}}}{\partial w_{i}} (t), \\ & \quad \quad0 \le t \le T, \ i = 1,2,\dots, M,\\ p(T) & = 0. \end{aligned} \right. $$(15)
Proof
According to Pontryagin Minimum Principle, for all admissible controls u′(t)∈Ω, it follows that
In particular, let
which is refined from the Hamiltonian function by removing coefficients. Because all elements of u are independent on each other, when t is given it follows that
Besides, by applying Pontryagin Minimum Principle again, it follows that
By calculation, we can get the above results. The proof is completed. □
The above two conditions shape the characteristics of optimal controls. By solving the formulated optimality system, we are able to find all possible optimal solutions to the optimal cloud assistance problem (12).
Further properties of optimal solutions
In the previous subsection, we derived the optimality system for seeking optimal solutions to the optimal cloud assistance problem (12), in which a sub-problem (14) needed to be solved.
Because the sub-problem is a bounded one-dimensional optimization problem, we can solve the problem by numerical searching. However, the searching can sometimes be time-consuming. By observing the sub-problem (14), we find that if the function h is continuous, the convexity and concavity of the function q(z)=h(zwi)−piwiz are dependent on those of the function h. By using this property, we can help accelerate solving the sub-problem (14) in some cases. The conclusions are given below.
As the first case, when the function h is convex, we can get the following conclusion.
Theorem 3
If the function h is continuous and convex, any local minimum of the function q is the global minimum of q as well. Moreover, if the function h is once continuously differentiable, it follows that: (a) if h′(wi(t))wi(t)−pi(t)wi(t)≤0, then ui(t)=1; (b) if h′(0)wi(t)−pi(t)wi(t)≥0, then ui(t)=0; (c) otherwise, ui(t) is the solution of the equation h′(ui(t)wi(t))wi(t)−pi(t)wi(t)=0.
Proof
As the function h is convex, the function q is convex as well. As a result, it follows from the Convexity Theory [50] that a local minimum of q must be the global minimum of q. Moreover, if q′(0)≥0, then q′(z)≥0,∀z∈[0,1], and therefore the minimum of q must be obtained at z=0. If q′(0)≤0, then q′(z)≤0,∀z∈[0,1], and therefore the minimum of q must be obtained at z=1. The proof is completed. □
Theorem 3 shows that if the function h is once continuously differentiable and convex, the component of the optimal control (i.e., ui(t)) may be a binary policy. This property can sometimes accelerate solving the optimal CA policy when ui(t) has a binary structure, because in that case we have no need to use the one-dimensional numerical searching method for solving the sub-problem (14).
As the second case, when the function h is concave, we can get the following conclusion.
Theorem 4
If the function h is continuous and concave, it follows that: (a) if h(0)≤h(wi(t))−pi(t)wi(t), then ui(t)=0; otherwise, ui(t)=1.
Proof
As the function h is concave, the function q is concave as well. As the result, the minimum of q must be obtained at {0,1} according to the values of q(0) and q(1). □
Theorem 4 shows that if the function h is continuous and concave, any component of the optimal control (i.e., ui(t)) must be a binary policy. This property will greatly accelerate solving the optimal CA policy, because we can simply compare the objective values of ui(t)=0 and ui(t)=1 when solving the subproblem (14).
Iterative algorithm
In the previous subsections, we derived an optimality system and discussed its properties. Now, we discuss how to find such a control that satisfies such a system. Because solving an optimality system essentially requires solving a two-point boundary value problem [51], the forward-backward sweep method (FBSM) [22] provides a practical approach. Based on the FBSM, we provide a specific algorithm (Algorithm 1), denoted by the optimal cloud assistance algorithm. In addition, we should mention that it is extremely difficult if not impossible to prove the convergence of this algorithm. An illustration of this difficulty can be found in [52]. Nevertheless, as reported in [53], the FBSM can be quickly run and shows a good convergence in general practical cases. Hence, we can still adopt the optimal cloud assistance algorithm. Moreover, it is difficult to find a previous theoretical analysis of the complexity of the FBSM method. We also had difficulty conducting such an analysis, and therefore we discuss the practical complexity of the algorithm through our numerical experiments.

In lines 5 and 7 of Algorithm 1, we need to solve two dynamic systems characterized by ordinary differential equations. To solve ordinary differential equations, it is possible to apply numerical methods such as the Euler [54] and Runge–Kutta [55] methods. The Runge–Kutta approach has been proven to be more accurate but more time-consuming than the Euler method owing to its complexity. Nevertheless, when the step length is small enough, the difference between the two methods is generally negligible.
The relations among the FBSM, the optimal cloud assistance algorithm, the Euler method, and the Runge–Kutta method are as follows: (a) the implementation of the FBSM is dependent on methods such as the Euler and Runge–Kutta approaches used for solving ordinary differential equations, and (b) the optimal cloud assistance algorithm is a practical application of the FBSM.
Illustrative examples
In the previous section, we discussed how to solve the optimal cloud assistance problem. In this section, we provide several numerical examples to illustrate the problem and its optimal policies.
The remainder of this paper proceeds as follows. First, we provide a description of the experimental environment. Second, we define some common experimental settings used in our study, including the topological structure of the edge computing network and the workload computation delay function g. We then introduce two numerical examples and provide a brief analysis of the results obtained. Next, we discuss some common phenomena shown in the numerical examples. Finally, we investigate the convergence and complexity of the practical algorithm.
Experimental environment
First, let us start with a description of the experimental environment, including the hardware environment, the use of parameter values, and the programming language used in the experiments. All numerical experiments described in this study were conducted on a PC machine with an Intel i3 9100F CPU and 16 GB of RAM. In addition, the parameter values involved in all experiments were determined according to our experience. In fact, some parameters, such as the capacity of an edge server, the increased traffic rate of a DDoS attack, and the communication delays between two servers, are dependent on specific scenarios, and thus it can be difficult to find the standard values for them. For this reason, we set the parameter values according to our experience, with the purpose of investigating the influences of optimal CA policies. Some existing studies also set the parameter values according to experience. See [41, 43, 56] for certain examples. Moreover, all numerical experiments were implemented using the C++ and Java programming languages.
Common setup
Let us move on to the topological structure of an edge computing network. Considering that there are M=10 ESs labeled by \(1,2,\dots,10\), as shown in Fig 3. Each server has the same capacity of at most 10k tasks being processed simultaneously. Then, suppose that the overall computation delay function of server workload is defined by

Diagram of the topological structure of the distributed edge computing system
where gmax is a constant coefficient. Figure 4 illustrates an instance of function g(x). This function implies that the overall computation delay is negligible when the workload of a server is much less than its capacity, but will increase sharply to a maximum of gmax if the workload approaches capacity.

An instance of the computation delay function g(x), where gmax=50
In the following two examples, we assume that the communication delay increases the function h as a linear function. This assumption is reasonable. For example, if it takes an average of 0.5 s to transmit one task from an edge server to the cloud, it will take an average of 1 s to transmit two tasks.
To validate the optimal policies obtained, we use the all-one policy u(1)(t)≡1 and the all-zero policy u(0)(t)≡0 as reference objects for the comparative experiments. The all-zero policy is used to investigate the situation in which there is no cloud assistance. The all-one policy is used to investigate the situation in which every edge server will always upload all pending tasks onto the cloud center. For convenience, we denote by w(0)(t) the workload distribution evolution function under the all-zero policy and w(1)(t) under the all-one policy. Moreover, we denote the obtained optimal policy by u∗(t), and denote the corresponding workload distribution evolution function by w∗(t).
Examples, results, and explainations
Having discussed the common experimental settings, we now introduce two numerical examples. To gain insight into the influences of different load balance schemes, the first example considers the RR scheme, and the second considers the LC scheme.
Example 1
Consider the situation that the total time horizon T=5 minutes (m), the initial workload w(0)=0 tasks, the task increasing rate α(t)≡(0,0,0,5,0,0,10,0,0,0) thousand tasks per minute (kt/m), the overall computation delay function g where gmax=1000 seconds per minute (s/m), the task forwarding ratio function \(f_{{ij}} = f^{RR}_{{ij}}\), the cloud assistance communication delay function h(z)=z seconds per thousand tasks (s/kt), and the task forwarding communication delay dij=0.3 seconds per thousand tasks (s/kt).
Results: The results of Example 1 are shown in Figs. 5, 6, and 7. Figure 5 shows the optimal policy. From Fig. 5, we can see that the related assistance rates of servers s4,s5,s6, and s7 maintain the maximum during the entire time horizon, whereas those of the other servers maintain the minimum. Moreover, as the function h has a concave property, it follows from Theorem 4 that the optimal policy has a binary structure. Figure 6 compares the workload distribution evolution under the optimal policy, the all-zero policy, and the all-one policy. Figure 7 compares the accumulated overall latency under the optimal policy, the all-zero policy, and the all-one policy. From Figs. 6 and 7, we can see the influence of the different policies:
-
Under the all-zero policy, the workload of servers s1,s2, and s3 increases linearly from zero to 4k tasks, the workload of servers s8,s9, and s10 increases linearly from zero to 7k tasks, and the workload of servers s4,s5,s6, and s7 increases linearly from zero to more than 10k tasks. As a result, the overall latency increases slowly for a long time after the beginning, but then increases dramatically to an unacceptable value of nearly 1.5k s owing to the high workload of servers s4,s5,s6, and s7.
Fig. 5 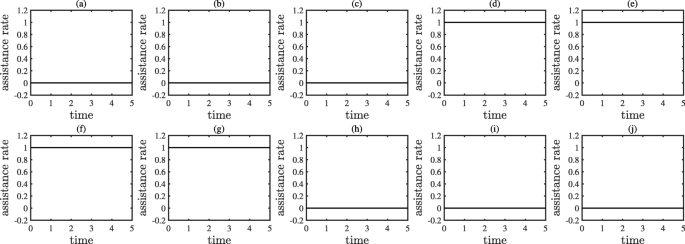
The optimal policy obtained from Example 1, where (a) to (j) show the elements \(u_{1}(t),u_{2}(t),\dots,u_{10}(t)\) in order
Fig. 6 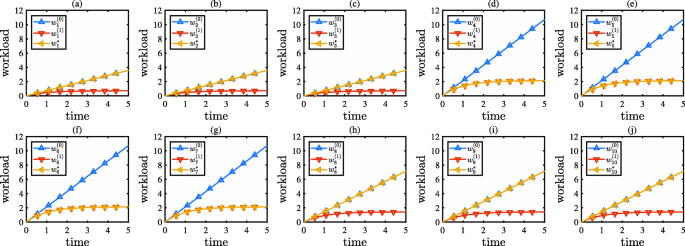
The workload distribution evolution obtained from Example 1, where (a) to (j) show the workload dynamics of servers \(s_{1},s_{2},\dots,s_{10}\) in order
Fig. 7 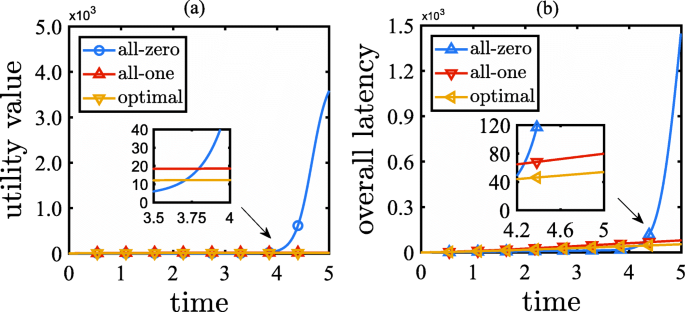
Performance results of Example 1: (a) the utility function over time; (b) the accumulated overall latency over time
-
Under the all-one policy, all servers enjoy low-level workload over the entire time horizon. As a result, the overall latency enjoys a low level of approximately 80 s.
-
Under the optimal policy, the workload of servers s1,s2, and s3 increases linearly to a low level of 4k tasks, the workload of servers s4,s5,s6, and s7 increases slowly to a low level of 2k tasks, and the workload of servers s8,s9, and s10 increases linearly to a middle level of 7k tasks. As a result, the overall latency enjoys a low level of nearly 50 s, which is 37.5% less than that of the all-one policy, and even much less than that of the all-zero policy.


From the above observations, we can conclude the following:
-
If the all-zero policy is adopted, there will be a high computation delay owing to the high server workload.
-
If the all-one policy is adopted, there will be a high communication delay owing to the long distance between the edge and cloud sides.
-
If the optimal policy is adopted, there will be a trade-off between the computation delay and communication delay, and thus the overall latency will be minimized.
Therefore, the obtained optimal policy is effective.
Reasons: When servers s4 and s7 are under attack, the workload of servers s4 and s7 will increases sharply and reach an intolerable level. In addition, because servers s5 and s6 are connected directly to both servers s4 and s7, and because the RR workload balance scheme will spread newly increased traffic among the connected servers, the workload of servers s5 and s6 will also quickly increase (more slowly than those of servers s4 and s7) and reach an intolerable level. The remaining servers (i.e., s1,s2,s3,s8,s9, and s10) are only connected to one of the servers, s4 or s7, and thus the workload of the remaining servers will increase at a relatively low rate within a tolerable range. To maintain the overall workload at a low level without introducing excessive communication latency, the servers s4,s5,s6, and s7 need to upload pending tasks to the cloud center at a high rate, whereas the remaining servers only need to handle the tasks with their own capacity to avoid unnecessary communication delays. If not, the EEC ecosystem will suffer high communication delays or high computation delays because the servers cannot cooperate effectively and make the best trade-off.
Example 2
Consider the situation that the total time horizon T=5 minutes (m), the initial workload w(0)=0 tasks, the task increasing rate α(t)≡(0,0,0,5,0,0,10,0,0,0) thousand tasks per minute (kt/m), the overall computation delay function g where gmax=1000 seconds per minute (s/m), the task forwarding ratio function \(f_{{ij}} = f^{LC}_{{ij}}\) where ε=0.001, the cloud assistance communication delay function h(z)=z seconds per thousand tasks (s/kt), and the task forwarding communication delay dij=0.3 seconds per thousand tasks (s/kt).
Results: The results of Example 2 are shown in Figs. 8, 9, and 10. Figure 8 shows the optimal policy. From Fig. 8, we can see that all related assistance rates maintain the maximum for a period of time after the beginning, then drop to and maintain the minimum before the termination time. Moreover, as function h has a concave property, it follows from Theorem 4 that the optimal policy has a binary structure. Figure 9 compares the workload distribution evolution under the optimal policy, the all-zero policy, and the all-one policy. Figure 10 compares the accumulated overall latency under the optimal policy, the all-zero policy, and the all-one policy. From Figs. 9 and 10, we can see the influence of different policies.
-
Under the all-zero policy, the workload of servers s1,s2, and s3 increases linearly from zero to 5k tasks, the workload of servers s8,s9, and s10 increases linearly from zero to 8k tasks, and the workload of servers s4,s5,s6, and s7 increases linearly from zero to more than 9k tasks. As a result, the overall latency increases slowly for a long time after the beginning, but then increases dramatically to nearly 90 s owing to the high workload of servers s4,s5,s6,s7,s8,s9, and s10.
Fig. 8 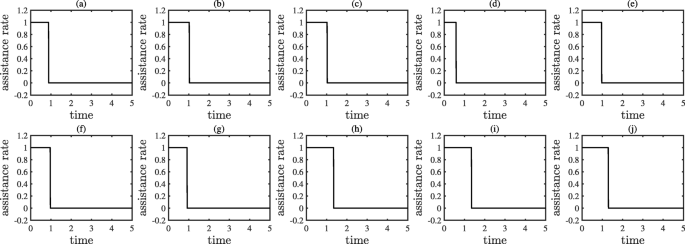
The optimal policy obtained from Example 2, where (a) to (j) show the elements \(u_{1}(t),u_{2}(t),\dots,u_{10}(t)\) in order
Fig. 9 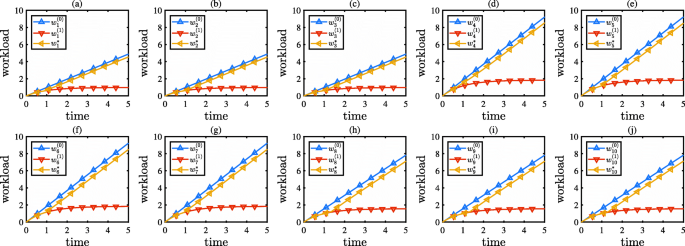
The workload distribution evolution obtained from Example 2, where (a) to (j) show the workload dynamics of servers \(s_{1},s_{2},\dots,s_{10}\) in order
Fig. 10 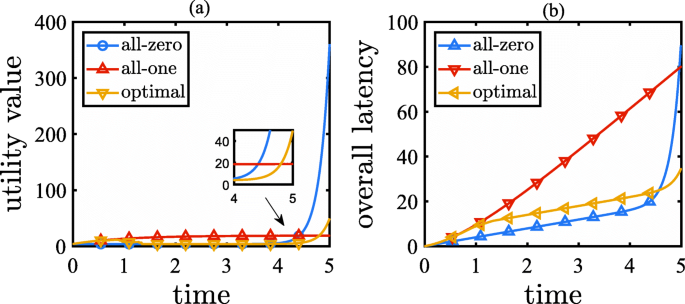
Performance results of Example 2: (a) the utility function over time; (b) the accumulated overall latency over time
-
Under the all-one policy, all servers enjoy low-level workload over the entire time horizon. As a result, the overall latency increases to nearly 80 s at the terminated time owing to unnecessary cloud assistance.
-
Under the optimal policy, the workload of all servers first increases slowly for a period of time after the beginning and then increase linearly before the termination time. At the termination time, the workload of servers s1,s2, and s3 enjoys a low level of 4.5k tasks, the workload of servers s8,s9, and s10 is at a middle level of 7k tasks, and the workload of servers s4,s5,s6, and s7 is at a high level of 8.5k. As a result, the overall latency enjoys a low level of 35 s, which is 61.1% less than that under the all-zero policy, and 56.3% less than that under the all-one policy.


From the above observations, we can conclude the following:
-
If the all-zero policy is adopted, there will be a high computation delay owing to the high server workload.
-
If the all-one policy is adopted, there will be a high communication delay owing to the long distance between the edge and cloud sides.
-
If the optimal policy is adopted, there will be a trade-off between the computation delay and communication delay, and thus the overall latency will be minimized.
Therefore, the obtained optimal policy is effective.
Reasons: When servers s4 and s7 are under attack, the workload of the servers s4 and s7 will increases sharply. In addition, because the servers s5 and s6 are connected directly to both servers s4 and s7, and because the LC workload balance scheme will rapidly spread newly increased traffic among connected servers, the workload of the servers s5 and s6 will also increase quickly. Although the remaining servers (i.e., s1,s2,s3,s8,s9,s10) are only connected to one of the servers s4 and s7, the workload of the remaining servers will increase at a relatively low but still high rate. Initially, to maintain the overall workload at a low level, all servers need to upload pending tasks to the cloud center at a high rate. After a while, all servers appear to know that if they continue to keep the cloud assistance rate at a high level, too much communication latency will be introduced. All servers also find that, despite not uploading any pending tasks to the cloud center, they can still absorb all attacking traffic using their remaining computation capacity. Although doing this will arguably increase the computation latency, the computation latency introduced is still lower than the communication latency incurred by all servers while maintaining high cloud assistance rates. To achieve the best trade-off, all servers decide not to upload pending tasks after a certain timestamp.
Discussions
In this subsection, we discuss the role of workload balance in mitigating edge DDoS attacks, the effectiveness of the EEC ecosystem in absorbing undetectable malicious traffic, and the influence of the DDoS attack on the overall latency.
From Figs. 6 and 9, we can see the role of workload balance. The two aforementioned numerical examples consider the same attack scenario, where only servers s4 and s7 are under attack. As shown in the experimental parameters, there are 75k malicious tasks hitting servers s4 and s7 during an attack. When applying the all-zero policy, no pending tasks will be uploaded onto the cloud, and all tasks will be processed in the edge computing network. Without a load balance, the servers s4 and s7 will have to handle all 75k attacking tasks, and their workload will become extremely high. With a load balance, idle edge servers can help handle a portion of the attack traffic. Figure 6 shows that the 75k malicious tasks at s4 and s7 will be non-uniformly dispatched among the edge computing network, which is determined by the characteristics of the RR scheme. Figure 9 shows that the 75k malicious tasks at s4 and s7 are relatively uniformly dispatched among the edge computing network, which is determined by the characteristics of the LC scheme. It seems that the LC scheme is more efficient than the RR scheme because the LC scheme can make the edge computing network absorb more traffic.
In addition, Figs. 6, 7, 9, and 10 show the effectiveness of an EEC ecosystem in absorbing undetectable malicious requests. When the edge computing network encounters a DDoS attack and malicious requests are undetectable, firewalls cannot filter out these abnormal requests, and the attacking traffic directly hits the target of the edge computing network. Without a cloud assistance of the EEC ecosystem, the edge workload distribution will evolve when applying the all-zero policy. The results show that the edge computing network cannot afford high-volume attack traffic. By contrast, with cloud assistance, resources can be efficiently allocated, and hence the overall latency can be dramatically reduced, as in the cases of applying the optimal policy and the all-one policy.
Moreover, by observing the cases of applying the all-zero policy, we can also see the influence of a DDoS attack. Without cloud assistance, all the attack traffic will be processed in the edge computing network, and the overall latency will only come from the communication delay of the load balance and the computation delays of the edge servers. From Fig. 7, we can see that, by applying the all-zero policy, the overall latency increases slowly before time t=4 but increases sharply after time t=4. This phenomenon is illustrated by the all-zero case in Fig. 6. We can see that before time t=4, the workload of all edge servers is fewer than 8k tasks, and after time t=4, the workload of servers s4,s5,s6, and s7 is more than 8k tasks. The computation delay function plotted in Fig. 4 shows that when the workload of a server is more than 8k tasks, the computation delay increases rapidly. Hence, the overall latency increases significantly after time t=4. Figure 10 shows a similar phenomenon, where the overall latency increases linearly before time t=4.5 but increases exponentially after time t=4.5. By observing the all-zero case in Fig. 9, we can see that before time t=4.5, all workload is fewer than 8k tasks, and after time t=4.5, the workload of servers s4,s5,s6, and s7 is more than 8k tasks. As a result, the computation delays of these edge servers increase rapidly. Therefore, we can conclude that, (a) initially, a DDoS attack will not seriously affect the overall latency because at that time the edge computing network can still handle the attack traffic itself, and (b) after a certain timestamp, the DDoS attack will significantly increase the overall latency because some edge servers in the network will have to suffer a high workload.
Algorithm convergence and complexity
Finally, let us investigate the algorithm convergence and complexity.
In Fig. 11, we show the algorithm convergence for each of the two numerical examples. From the results, we can see that the optimal cloud assistance algorithm (Algorithm 1) shows a good convergence. The objective functional (overall latency) can converge quickly with only several iteration steps, which matches the discussion in [53].

Algorithm convergence: (a) the result of Example 1, (b) the result of Example 2
By observing the proposed optimal cloud assistance algorithm (Algorithm 1), we found that the termination time T is an essential factor in the algorithm complexity. For each iteration step, we need to solve multiple ordinary differential equations and a one-dimensional optimization sub-problem. Given a method to solve the sub-problem, the overall algorithm complexity is mainly dependent on solving ordinary differential equations. If we set the same step length of time when numerically solving ordinary differential equations, the termination time T determines the overall algorithm complexity.
Hence, to gain insight into the complexity of the algorithm, we investigate how the practical time consumption will increase as the termination time T increases. Numerical experiments were conducted in the same hardware environment. In Fig. 12, we show the practical time consumption for each of the two numerical examples. From the results, we can see that the proposed optimal cloud assistance algorithm (Algorithm 1) runs quickly and shows a linear complexity for the terminated time T.

Practical time consumption (seconds): (a) the result of Example 1, (b) the result of Example 2
Conclusion
In this paper, the design of optimal cloud assistance policies for the use of an end-edge-cloud ecosystem to mitigate edge DDoS attacks is described. First, we propose an edge workload model that incorporates the edge server workload distribution evolution under a given cloud assistance policy. Based on the model, we quantify the effectiveness of the policy based on the resulting overall latency and formulate an optimal control problem for seeking optimal cloud assistance policies that can minimize the overall latency. Then, following the Pontryagin’s minimum principle, we provide solutions by deriving an optimality system. To accelerate the problem solving, we also discuss some properties of the optimal solutions. Next, we introduce a numerical iterative algorithm based on the forward–backward sweep method to seek policies that satisfy the derived optimality system. Finally, we provide numerical examples to illustrate the optimal policies. Our work will assist in the development of a design for using an end-edge-cloud ecosystem to mitigate edge DDoS attacks.
Availability of data and materials
The data used during the current study are available from the corresponding author on reasonable request.
References
Nord JH, Koohang A, Paliszkiewicz J (2019) The internet of things: Review and theoretical framework. Expert Syst Appl 133:97–108.
Ray PP (2018) A survey on internet of things architectures. J King Saud Univ-Comput Inf Sci 30(3):291–319.
Abbas N, Zhang Y, Taherkordi A, Skeie T (2017) Mobile edge computing: A survey. IEEE Internet Things J 5(1):450–465.
Mao Y, You C, Zhang J, Huang K, Letaief KB (2017) A survey on mobile edge computing: The communication perspective. IEEE Commun Surv Tutor 19(4):2322–2358.
Mahmood K, Li X, Chaudhry SA, Naqvi H, Kumari S, Sangaiah AK, Rodrigues JJ (2018) Pairing based anonymous and secure key agreement protocol for smart grid edge computing infrastructure. Futur Gener Comput Syst 88:491–500.
Hossain MS, Muhammad G (2017) Emotion-aware connected healthcare big data towards 5G. IEEE Internet Things J 5(4):2399–2406.
Shladover SE (2018) Connected and automated vehicle systems: Introduction and overview. J Intell Transp Syst 22(3):190–200.
Zargar ST, Joshi J, Tipper D (2013) A survey of defense mechanisms against distributed denial of service (ddos) flooding attacks. IEEE Commun Surv Tutor 15(4):2046–2069.
Osanaiye O, Choo K-KR, Dlodlo M (2016) Distributed denial of service (ddos) resilience in cloud: review and conceptual cloud ddos mitigation framework. J Netw Comput Appl 67:147–165.
Kolias C, Kambourakis G, Stavrou A, Voas J (2017) Ddos in the iot: Mirai and other botnets. Computer 50(7):80–84.
De Donno M, Dragoni N, Giaretta A, Spognardi A (2018) Ddos-capable iot malwares: Comparative analysis and mirai investigation. Secur Commun Netw 2018:1–30.
Vlajic N, Zhou D (2018) Iot as a land of opportunity for ddos hackers. Computer 51(7):26–34.
Jia Y, Zhong F, Alrawais A, Gong B, Cheng X (2020) Flowguard: An intelligent edge defense mechanism against iot ddos attacks. IEEE Internet Things J 7:9552–9562.
Liu J, Wang X, Shen S, Yue G, Yu S, Li M (2020) A bayesian q-learning game for dependable task offloading against ddos attacks in sensor edge cloud. IEEE Internet Things J 8:7546–7561.
Xu Z, Liang W, Jia M, Huang M, Mao G (2018) Task offloading with network function requirements in a mobile edge-cloud network. IEEE Trans Mob Comput 18(11):2672–2685.
Ren J, Zhang D, He S, Zhang Y, Li T (2019) A survey on end-edge-cloud orchestrated network computing paradigms: Transparent computing, mobile edge computing, fog computing, and cloudlet. ACM Comput Surv (CSUR) 52(6):1–36.
Hong Z, Chen W, Huang H, Guo S, Zheng Z (2019) Multi-hop cooperative computation offloading for industrial iot–edge–cloud computing environments. IEEE Trans Parallel Distrib Syst 30(12):2759–2774.
Wang B, Wang C, Huang W, Song Y, Qin X (2020) A survey and taxonomy on task offloading for edge-cloud computing. IEEE Access 8:186080–186101.
Khalil IM, Khreishah A, Azeem M (2014) Cloud computing security: a survey. Computers 3(1):1–35.
Hashem IAT, Yaqoob I, Anuar NB, Mokhtar S, Gani A, Khan SU (2015) The rise of “big data” on cloud computing: Review and open research issues. Inf Syst 47:98–115.
Donald EK (2004) Pontryagin’s minimum principle and state inequality constrains. In: Donald EK (ed)Optimal Control Theory: An Introduction, 2nd edn., 227–239.. Dover Publications, New York.
Lenhart S, Workman JT (2007) Forward-backward sweep method. In: Etheridge AM Gross LJ (eds)Optimal Control Applied to Biological Models, 2nd edn., 49–56.. CRC Press, Boca Raton.
Yu S, Zhou W, Doss R (2008) Information theory based detection against network behavior mimicking ddos attacks. IEEE Commun Lett 12(4):318–321.
Xie Y, Yu S-Z (2008) Monitoring the application-layer ddos attacks for popular websites. IEEE/ACM Trans Netw 17(1):15–25.
Wang J, Yang X, Long K (2011) Web ddos detection schemes based on measuring user’s access behavior with large deviation In: 2011 IEEE Global Telecommunications Conference-GLOBECOM 2011, 1–5.. IEEE, Piscataway.
Wen S, Jia W, Zhou W, Zhou W, Xu C (2010) Cald: Surviving various application-layer ddos attacks that mimic flash crowd In: 2010 Fourth International Conference on Network and System Security, 247–254.. IEEE, Piscataway.
Ni T, Gu X, Wang H, Li Y (2013) Real-time detection of application-layer ddos attack using time series analysis. J Control Sci Eng 2013:1–6.
Zhou W, Jia W, Wen S, Xiang Y, Zhou W (2014) Detection and defense of application-layer ddos attacks in backbone web traffic. Futur Gener Comput Syst 38:36–46.
Ujjan RMA, Pervez Z, Dahal K, Bashir AK, Mumtaz R, González J (2020) Towards sflow and adaptive polling sampling for deep learning based ddos detection in sdn. Futur Gener Comput Syst 111:763–779.
Hosseini S, Azizi M (2019) The hybrid technique for ddos detection with supervised learning algorithms. Comput Netw 158:35–45.
Gao H, Tang M, Liu Y, Zhang P, Liu X (2017) Research on the security of microsoft’s two-layer captcha. IEEE Trans Inf Forensics Secur 12(7):1671–1685.
Tang M, Gao H, Zhang Y, Liu Y, Zhang P, Wang P (2018) Research on deep learning techniques in breaking text-based captchas and designing image-based captcha. IEEE Trans Inf Forensics Secur 13(10):2522–2537.
Zi Y, Gao H, Cheng Z, Liu Y (2019) An end-to-end attack on text captchas. IEEE Trans Inf Forensics Secur 15:753–766.
Wang P, Gao H, Rao Q, Luo S, Yuan Z, Shi Z (2020) A security analysis of captchas with large character sets. IEEE Trans Dependable Secure Comput. https://doi.org/10.1109/TDSC.2020.2971477.
Kim K, You Y, Park M, Lee K (2018) Ddos mitigation: Decentralized cdn using private blockchain In: 2018 Tenth International Conference on Ubiquitous and Future Networks (ICUFN), 693–696.. IEEE, Piscataway.
Imthiyas M, Wani S, Abdulghafor RAA, Ibrahim AA, Mohammad AH (2020) Ddos mitigation: A review of content delivery network and its ddos defence techniques. Int J Perceptive Cognitive Comput 6(2):67–76.
Noh D-H, You D-Y, An B-K (2009) A solution method for ddos attack using cdn technology. J Inst Internet Broadcast Commun 9(2):91–96.
Wang D, Chen D, Guo R (2013) Ddos mitigation in content distribution networks. Int J Wirel Mob Comput 6(5):508–514.
Al-Qudah Z, Al-Duwairi B, Al-Khaleel O (2014) Ddos protection as a service: hiding behind the giants. Int J Comput Sci Eng 9(4):292–300.
Li X, Ge X, Wang X, Cheng J, Leung VC (2016) Energy efficiency optimization: Joint antenna-subcarrier-power allocation in ofdm-dass. IEEE Trans Wirel Commun 15(11):7470–7483.
You C, Huang K, Chae H, Kim B-H (2016) Energy-efficient resource allocation for mobile-edge computation offloading. IEEE Trans Wirel Commun 16(3):1397–1411.
Wang Y, Sheng M, Wang X, Wang L, Li J (2016) Mobile-edge computing: Partial computation offloading using dynamic voltage scaling. IEEE Trans Commun 64(10):4268–4282.
Mao Y, Zhang J, Letaief KB (2016) Dynamic computation offloading for mobile-edge computing with energy harvesting devices. IEEE J Sel Areas Commun 34(12):3590–3605.
Zhang Z, Yu FR, Fu F, Yan Q, Wang Z (2018) Joint offloading and resource allocation in mobile edge computing systems: An actor-critic approach In: 2018 IEEE Global Communications Conference (GLOBECOM), 1–6.. IEEE, Piscataway.
Chen Y, Zhang N, Zhang Y, Chen X (2018) Dynamic computation offloading in edge computing for internet of things. IEEE Internet Things J 6(3):4242–4251.
Chen Y, Zhang N, Zhang Y, Chen X, Wu W, Shen XS (2019) Energy efficient dynamic offloading in mobile edge computing for internet of things. IEEE Trans Cloud Comput. https://doi.org/10.1109/TCC.2019.2898657.
Zhang G, Zhang W, Cao Y, Li D, Wang L (2018) Energy-delay tradeoff for dynamic offloading in mobile-edge computing system with energy harvesting devices. IEEE Trans Ind Inf 14(10):4642–4655.
Rasmussen RV, Trick MA (2008) Round robin scheduling–a survey. Eur J Oper Res 188(3):617–636.
Teo YM, Ayani R (2001) Comparison of load balancing strategies on cluster-based web servers. Simulation 77(5-6):185–195.
Bertsekas DP (1997) Nonlinear programming. J Oper Res Soc 48:334–334.
Keller HB (2018) Numerical Methods for Two-point Boundary-value Problems. Courier Dover Publications, New York.
McAsey M, Mou L, Han W (2012) Convergence of the forward-backward sweep method in optimal control. Comput Optim Appl 53:207–226.
Lenhart S, Workman JT (2007) Optimal Control Applied to Biological Models. CRC press, Boca Raton.
Hoffman JD, Frankel S (2001) The first-order euler method. In: Frankel S (ed)Numerical Methods for Engineers and Scientists, 2nd edn., 352–370.. CRC Press, Boca Raton.
Butcher JC (2008) Runge-kutta methods. In: Butcher JC (ed)Numerical Methods for Ordinary Differential Equations, 2nd edn., 97–108.. Wiley, Hoboken.
Guo X, Singh R, Zhao T, Niu Z (2016) An index based task assignment policy for achieving optimal power-delay tradeoff in edge cloud systems In: 2016 IEEE International Conference on Communications (ICC), 1–7.. IEEE, Piscataway.
Acknowledgements
Not applicable.
Funding
This research was funded by Chongqing Municipal Education Commission grant number KJ QN201903110.
Author information
Authors and Affiliations
Contributions
Authors’ contributions
TL is the only contributor of this paper. The author read and approved the final manuscript.
Authors’ information
Teng Li received the B.Sc. degree from the School of Economics and Business Administration, Chongqing University, in 2006, and the M.Sc. degree from the School of Software Engineering, Chongqing University, in 2009. He is currently an Associate Professor with the Artificial Intelligence and Big Data College, Chongqing College of Electronic Engineering. His research interests include cloud computing, edge computing, and cyber security.
Corresponding author
Ethics declarations
Competing interests
The author declares that there is no competing interests.
Additional information
Publisher’s Note
Springer Nature remains neutral with regard to jurisdictional claims in published maps and institutional affiliations.
Rights and permissions
Open Access This article is licensed under a Creative Commons Attribution 4.0 International License, which permits use, sharing, adaptation, distribution and reproduction in any medium or format, as long as you give appropriate credit to the original author(s) and the source, provide a link to the Creative Commons licence, and indicate if changes were made. The images or other third party material in this article are included in the article’s Creative Commons licence, unless indicated otherwise in a credit line to the material. If material is not included in the article’s Creative Commons licence and your intended use is not permitted by statutory regulation or exceeds the permitted use, you will need to obtain permission directly from the copyright holder. To view a copy of this licence, visit http://creativecommons.org/licenses/by/4.0/.
About this article

Cite this article
Li, T. Optimal cloud assistance policy of end-edge-cloud ecosystem for mitigating edge distributed denial of service attacks. J Cloud Comp 10, 42 (2021). https://doi.org/10.1186/s13677-021-00257-3
Received:
Accepted:
Published:
DOI: https://doi.org/10.1186/s13677-021-00257-3