- Research
- Open access
- Published:
Cost optimization in cloud environment based on task deadline
Journal of Cloud Computing volume 12, Article number: 9 (2023)
Abstract
The popularity of cloud and fog services has raised the number of users exponentially. Main advantage of Cloud/fog infrastructure and services are crucial specially for commercial users from diverse areas. The variety of service requests with different deadlines makes the task of a service broker challenging. The fog and cloud users always lookfor a suitable compromise between cost and quality of service in terms of response time therefore, the cost optimization is vital for the cloud/fog service providers to capture the market. In this paper an algorithm, Cost Optimization in the cloud/fog environment based on Task Deadline (COTD) is proposed that optimizes cost without compromising the response time. In this algorithm the task deadline is considered as a constraint and an appropriate data center for task processing is selected. The proposed algorithm is suitable for runtime decision making due to its low complexity. The proposed algorithm is evluated using a well-known simulation tool Cloud Analyst. Our comprehensive testbed simulations show that COTD outperforms the existing schemes, Service Proximity Based Routing and Performance-Optimized Routing. The proposed algorithm successfully minimizes the cost by 35% on average while maintaining the response time.
Introduction
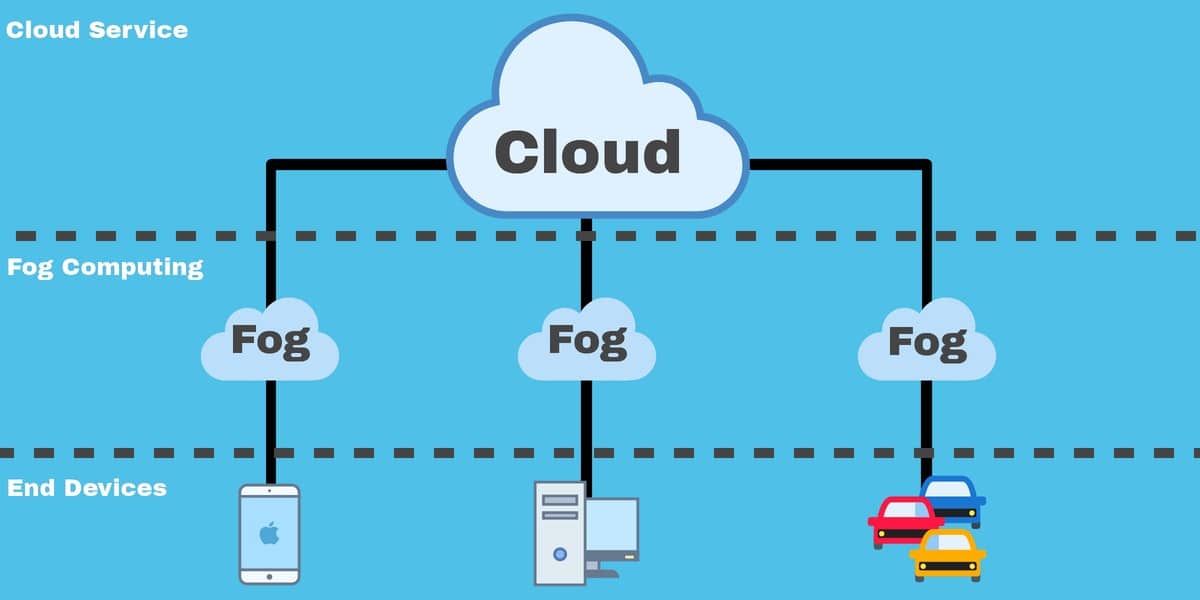
Nowadays, cloud computing [1] plays the role of backbone in industry, and education systems [2] and its popularity causes exponential growth in cloud data and network traffic [3]. The exponential increase in the data and network traffic cause challenges in cloud computing [4] for instance, overloading of data centers and delays in task processing eventhough some tasks are time critical. Thus, only an efficient system is desirable to handle such tasks without delays. Later, to overcome the challenges of existing cloud architecture [5], fog computing was proposed by CISCO [6]. It is a replica of the cloud with limited resources available locally near the network edge as presented in Fig. 1. The significance of the fog layer is to reduce the network traffic and minimize the load of cloud data centers and network latency [7]. This infrastructure helps to process the crucial and time-sensitive tasks, and to enhance the quality of service (QoS) [8] and quality of experience (QoE) [9]. Although, the idea of a fog layer enhances the QoS, minimizes the cloud data center’s load and network latency. Despite this enhancement, the fog layer has relatively fewer resources and an efficient as well as cost-saving resource allocation is required for the best utilization of available resources and to minimize the cost.

Cloud/Fog Computing Architecture
In a normal tiered fog-cloud environment, user requests are forwarded to suitable computing devices [10] based on some pre-defined criteria. These user requests can be classified based on the type of services and task deadline. In case of task deadlines, tasks are further divided into two main classes: 1) short deadlines tasks and 2) long deadlines tasks. Short deadline tasks are time-sensitive and need special resources for completion within a time, whereas long deadline tasks can be delayed to some extent. To meet the task deadlines with the best services, a lot of service broker techniques have been proposed to minimize the response time [10]. However, most of these strategies forward the task to the nearby data centers and neglect the cost factor.
Cloud cost optimization has been the top priority of the most organizations over the last few years, evident from Flexera’s report 2021Footnote 1 as shown in Fig. 2. The users of cloud and fog always need the best services, at the lowest cost. In this regard, many techniques are proposed to cut down the response time and execution time however, the cost factor is equally crucial. Since, the service cost is a major factor to provide QoS, especially for commercial customers therefore, compromising the response time for long deadline requests is desirable as compared to the compromise in the cost factor. In addition, the high service cost can adversely affect the Service Level Agreements and the service quality, which can eventually reduce the market value of service providers. Therefore, the main focus of this research work is to optimize the cost without compromising the increased response time.

Flexera’s state of the cloud report 2021
The major contributions of this research are:
-
Comprehensive literature review of the existing techniques for cloud resource allocation for service requests.
-
A cost optimization service broker strategy is proposed that maintains the response time.
-
Extensive simulations using Cloud Analyst are performed by setting up a variety of scenarios to validate the proposed work.
The rest of the paper is organized as follows: related work describes the related work, the problem is formulated in problem and formulation and proposed work presents the proposed algorithm. The simulation setup and results are discussed in results and analysis. Eventually, the paper is concluded in conclusion.
Related work
In the relevant literature, number of service broker policies are available for cloud and fog computing environments, however, most of these algorithms mainly minimize total Response Time(RT) and focus on efficient use of resources. For instance, many of the designed service brokering techniques reflect the cost as a performance factor many consider the RT and some of them focus on the execution time. The cost and the response time are inversely related. Likewise, the techniques that aim to reduce the RT time, increase the total cost, and the request execution time. Some relevant approaches are discussed in this section.
Wickremasinghe et al. [11] introduce a unique tool, Cloud Analyst along with a new technique to simulate a wide range of extensive applications of the cloud. More importantly, this study will generate valuable insight into the planning of cloud infrastructure facilities. In the cloud architecture load balancing techniques and service broker algorithms in data centers enhance the performance of the application and cost to the proprietors. This tool provides a wide range of options and a graphical, view and control to the research community to simulate their work with a variety of scenarios. In this research work, the same tool is used to validate the proposed technique.
Tyagi et al. [12] used the throttled load balancing brokering technique along with an optimized RT service brokering policy to reduce the cost and RT. Tries different load balancing techniques available in the cloud analyst to find the optimal solution that delivers the best results. The results presented after the simulation demonstrate that the RT and data center processing time is optimum but the cost increases. Ramasubbareddy et al. [13] examined different load balancing techniques available in cloud analyst simulation tools and performed many test case scenarios. The simulation results of all the available algorithms in a cloud analyst show that throttled load balancing technique minimizes the total RT and data center processing time while in terms of cost all algorithms show the same result.
Naha et al. [14] try to reduce the cost and minimize the data center processing time and overall RT. He proposed three different service brokering methods and a load balancing technique. The simulation of all three algorithms shows better results as compared to the previously available algorithm Service Proximity Service Broker. While comparing the results of these algorithms with each other shows that from the three proposed algorithms Load Aware over Cost Algorithm shows maximum performance in the context of cost, data center processing time, and overall RT. Ahmad Manasrah et al. [15] Proposed and improved service brokering policy, the main working principle of the designed technique is a differential evolution method to decrease the cost, overall RT and processing time. The main idea is to process the different tasks on different machines by finding an optimum solution from the best conceivable solution. The results of the proposed technique compared with the algorithms available in cloud analysts show that the algorithm performs better at a data center processing time and in overall RT but the cost factor increases.
Kulkarni et al. [16] Designed a cost-aware service brokering technique to save costs in the Geo-distributed datacenter in the cloud and fog atmosphere. In the proposed solution the electricity factor is used to minimize the cost and the algorithm works on the principle to find out the data center has the lowest electricity cost instead of the closely located data center and process maximum requests on that data center. The results presented after the simulation demonstrate the proposed algorithm shows the best results and saves cost. Jain et al. [17] Proposed a service brokering technique based on fuzzy rules along with a service broker algorithm to increase the overall performance of cloud services. The performance of the proposed solution can be measured in expressions of energy consumed the quantity of energy consumed on the communication and data processing of tasks is measured and calculated in joule and tasks or processed at the data center which consumed less amount of energy selected by the algorithm. The results of the proposed technique show that the proposed technique has drawn better performance while comparing with existing algorithms. Rekha et al. [18] propose an approach called dynamic cost-load aware service brokering algorithm to reduce the overall RT, execution time, and the cost of Virtual machines by using a heuristic-based approach. In the proposed algorithm VMs are sorted region-wise and arranged in the increasing order of processing speed and select the VM from the list with the highest processing speed. The simulation and test scenarios show that the algorithm performance variables in different scenarios in some scenarios result in significant cost and processing time while in some scenarios results are not better.
Patel et al. [19] proposed a technique for balancing load inside the data center that works on VM to host ratio and freely available resources. The proposed algorithm selects the nearest region and picks up the data centers and finds the percentage of free resources and active host to VM ratio and based on these parameters, executes the task on the best available resource. The test results conducted on the cloud analyst simulation tool show better results and minimize the RT and datacenter processing time as compared to cloud analyst available algorithms. Al-Tarawneh et al. [20] Proposed an algorithm, Adaptive User-Oriented Fuzzy-Based Service Broker to minimize the cost and increase the performance depending on the user preferences. The designed algorithm decides based on performance or a preference-aware environment and executes the task as per requirement. The simulation results conducted on cloud analysts show improvement in response time by user base and data center processing time but the cost factor remains the same. Benlalia at al [21]. proposed the technique for the optimization of cost and RT. The service broker algorithm works based on cost and efficiency for the selection of the best available resource to minimize the overall cost and RT. The main idea was to maintain the list of Efficiency Cost data centers and the threshold value of each data center and process the request on these criteria. Nayak et al. [22] Proposed a brokering technique based on the deadline, The proposed algorithm is the extension of the backfilling technique. The proposed technique focuses on the weak points of the backfilling algorithm and improves the scheduling process by maximizing the acceptance ratio of tasks and by minimizing the rejection ratio of the task. Simulation results show better results.
Jyoti et al. [23] work on another solution that works on the dynamic provisioning of resources and is based on service brokering and load balancing. An agent called Local User Agent (LUA) predicts the activities of the users in the environment and based on these activity tasks and allocates them to the VM based on priority. Global User Agent (GUA) is used to provide services to the user bases and schedule the tasks. The result of this technique shows that the proposed technique performs better as compared with other techniques in terms of ET, WT, and makespan. Junaid et al. [24] Proposed a hybrid model for balancing the load in cloud computing. The proposed solution performs the classification of the files present in the cloud and classification is performed with the help of a support vector machine (SVM) and the resultant data is forwarded into an algorithm named Ant Colony Optimization (ACO) works on a metaheuristic technique for better results. Results after the simulation show that the algorithm performs better in scalability and robustness.
Ghasemi et al. [25] Presented a machine learning base technique that works on machine learning aimed to divide the load of host machines. In the proposed technique from permissible action, an action was selected by a learning agent and executed in the environment. The simulation result of the proposed algorithm enhanced the inter HM load balancing in the context of processor, memory, and BW, and it concluded that the proposed technique can be more active and perform better in load balancing. Junaid et al. [26] Proposed an algorithm for load balancing named Data Files Type Formatting (DFTF) that works on an enhanced version of Cat Swarm Optimization (CSO) besides with SVM. In the proposed technique cloud data is classified from various sources and the classified data are sent to the uvpgraded load balancing algorithm that quickly distributes the load on VMs. The results after the simulation of the proposed technique show improved performance from the other baseline algorithms in terms of throughput, response time, and migration time. Table 1 presents the summary of previously proposed techniques.
Maswood et al. [27] proposed three-layer fog-cloud computing, optimization model to minimize the bandwidth and cost with better load balancing in terms of bandwidth and CPU processing capacity. The proposed technique works on the priority model and both are inversely proportional to each other if the cost is the priority factor bandwidth increase and if the bandwidth is a priority factory cost increase however simulation results show that the proposed algorithm minimizes cost and bandwidth.
According to the discussed literature in Table 1, most of the approaches consider response time and cost without considering the deadline factor. In the discussed studies, the priority model and closest data center models are mostly used. We in this research work, consider deadline based model to reduce the cost and maintain RT which sets novelity of the this work It is assumed that the cost considered in this work includes both, the resquest processing cost and data transfer cost. The data centers and user bases are fully connected. The proposed algorithm is suitable where the request deadlines are most crucial factor, however some other factors such as load balancing, energy consumption and bandwidth is not considered.
There is lot of latest advancement in the relavent area along with the huge amount of data generation [31]. Reseachers are focusing the intelligent and machine learning algorithms in almost every area including termal management of data centers [32], off-loading and resource management [33], virtual manchine migration for fault tolerance and numerous other purposes [34]. However, the proposed work is a heuristic with the limiatation of perdctive behavior and handling big data is out of scope.
Problem formulation
The proposed work aims to process the user’s requests on the most appropriate data center to minimize the cost and maintain response time. In the proposed work, cost optimization is formulated as under. Assume, R is the set of six geographically separated Regions that is given by, R = {r1, r2, …r6} and each region contains n number of Data Centers (DC), DC = {dc1, dc2, …dcn} that is distributed geographically into 6 regions. Along with DC, each region has m number of User Bases (UB), UB = {ub1, ub2, …ubm}. Each user base in a region has a set of users that generate numerous Requests, RT = {req1, req2, …reqk}. All the abbriviations used in problem formulation are listed in Table 2.
Each request generated from a UB is forwarded to the service broker and its policy determines the destination DC, in response service broker returns the destination DC. Performance (P) is given by the set of performance metrics of broker policy ,P = {RT, PT, Cost}. In the set P, RT is the Response Time, PT is the Processing Time of the task and cost is dependent on four different factors that include Virtual machine (VM) cost, storage, memory, and data transfer cost. Response time is expressed as the total time when a user generates a request and receives its reply from DC. The RT of a request is defined by using Eq. (1).
Where DT is the total Data transfer Time of the request. DT is given by using Eq. (2)
The above equation relates the data or size of the request, with the Bandwidth (BW) of the network or communication link and the Latency of the network.
Numerous requests are generated by different user bases and forwarded to the different data centers in the region based on the service broker policies. DCs process these requests accordingly. Policies are designed to deliver the best results to meet the Service Level Agreement (SLA) and maintain QoS.
Whenever a new request is received, the response time of the available DCs is determined by using Eq. (1). From the list of available DCs the minimum and maximum RT of the request is identified and the threshold value (Th) is calculated by using Eq. (3).
Where minRT and maxRT are the estimated response time of the available data centers in all the regions to calculate the threshold. The threshold value is compared with the deadline of requests that classify the requests based on the priorities as shown below.
Where, dlinereqk of Req. is the deadline of any request. The high priority requests are then forwarded to the DC that provides a minimum response time to complete the request at the earliest, however low priority requests are compromised at RT and processed at DCs with minimum cost.
Proposed work
The primary goal of the proposed technique is to reduce the cost while maintaining the RT for the user requests based on their deadline and forwarding it to the most appropriate data centers. In this regard, the proposed COTD technique maintains a list of all available data centers in the regions around the globe. When new requests arrive at the proposed COTD technique, it decides the DB based on the deadline. The requests with a greater deadline are forwarded to those data centers that incur a low cost, whereas the requests with a earlier deadline are forwarded to the closest data centers to meet the request deadline. The proposed technique also verifies the validity of the received requests. The COTD technique consists of three phases. In the first phase, the threshold value is determined by using the response time in the second phase, the deadline of the task is compared with the minimum response time of the available data centers, and in the last phase, the deadline of the task is compared with the calculated threshold. Eventually, the requests are forwarded to a suitable data center based on the deadline. Thes second and third phases are dicision maker phases where user request is compared as shown in Fig. 3.

Block diagram of the proposed technique CTOD
Threshold calculation
When a new request is generated, it enquires about the service broker policy for the destination data center. The service broker retrieves the region of the request generation and the deadline of each request and gets the list of all available data centers. The proposed strategy reiterates the list of obtainable data centers and estimates a current minimum and maximum RT and based on that threshold is calculated using Eq. 3. In the threshold calculation, minRT is the last recorded minimum response time while maxRT is the last recorded maximum response time. The calculated threshold value is the calculated period used to calculate the importance of the request. Task deadline, then compared with the calculated threshold value to check the criticality of the request. If the deadline of the request is less than the calculated value it means that the request has a short deadline and needs to be processed on top priority and COTD forwards the request to the nearest and fastest data center so that the request is processed in minimum response time and maintains the QoS. If the deadline to request is greater than the calculated threshold value it means the request has a low priority and may have some delays, so COTD forwards the request to the data center having minimum cost in the region to save the maximum cost. The threshold calculation phase is the main phase of the proposed methodology.

The variable dclist in the algorithm 1 is the list of all available and active data centers distributed globally. This variable is used to get the list of all available data centers. Instructions 2 and 3 in the algorithm 1 signify minimum and maximum response times from the list of available data centers. Variable minRT gets the minimum current response time while maxRT variable gets the maximum response time. Variable thValue in the algorithm 1 is used to store and return the calculated threshold value. The threshold value is calculated by taking the mean of minRT and maxRT. Later, this thValue is used in the algorithm 2 to decide a data center to process the request.
Request acceptance based on deadline
In the second phase, when a request is received by the internet cloudlet, the internet cloudlet queries the destination data center from the service broker policy. COTD retrieves the deadline of the request and list of available data centers and iterates with the list of available data centers to get the current response time (RT) of all data centers from the list of available data centers, COTD picks up the minimum current response time and then compare this value with the deadline of received requests by using eq. (4). The purpose of this comparison is to ensure that the request could be processed or not within the given deadline. If the deadline of the request is less than the minimum response time it means that the request cannot be processed within the given deadline and the request is rejected for a new deadline. If the deadline of the request is greater than the minimum response time, the request is accepted and moved to the next phase. This process will save the resources and do not forward any request that cannot be processed in a given deadline. Because if a request that cannot be processed in a given deadline, and it is forward to the destination data center, it may consume resources and hence results are not useful.
Data Centre selection
The main phase of the proposed methodology is data centre selection, in this phase whenever a new request arrives, COTD retrieves the region of the request and the deadline of each request. Later, COTD compares the deadline of each request with the calculated threshold value by using eq.(5). Afterwards,, COTD decides the destination data center. If the deadline of the received request is less than the pre-calculated threshold value, the task is considered to be a high priority, which means the request must be completed at a given deadline and processed in the data center that provides the best services. If the deadline of the request is greater than the pre-calculated threshold value, the task is considered to be of a low priority and can bear some delays and be processed in a data center having minimum cost.
Finally, after comparison of the threshold value with the request deadline, service broker decides the best possible data center to service the request. If the deadline is less than the threshold value from the list of available data centers COTD returns the ID of the nearest data center that provides the minimum response time and identifies it by using the region of the request. If the deadline of the request is greater than the threshold value, then from a list of available data centers COTD returns the ID of the data center that has a minimum overall cost.
The pseudocode of the proposed algorithm COTD is presented as Algorithm 2. The algorithm is consists of two stepts. In the fist step, the threshold value for all incoming requests is calculated using the current calculated response time values. In the second step, based on the pre-calculated threshold value, requests are forwarded to the most appropriate data center.
In the algorithm 2, instruction 2 is used to get the deadline of the request, the deadline of the request is some period specified in the request, which means that the request must be processed and received the response within that specified time. The variable reqReg used to get the region of the request used, if the request has a small deadline. Instructions 4 and 5 are used to get the list of all available data centers and sort them in order of minimum to maximum response time and cost. The sixth instruction in the algorithm 2, retrieves the pre-calculated threshold value, calculated using algorithm 1, this threshold value is a period calculated using the current minimum and maximum response time.

Instructions 7 to 11 are conditional statements; they are used to prevent the system resources. This conditional statement checks whether the request can be processed or not by the mentioned deadline and ensures that only those requests should be forwarded to the data center that can be processed within the specified time. If the request fulfills the above condition, then the deadline of the request is compared with the calculated threshold value in instruction 13. The instruction 13 portrays the main idea of the algorithm, that compares the deadline of the request with the calculated threshold value in the algorithm 1, and if the deadline is less than the calculated threshold value, the request is forwarded to the data center having a minimum response time or the data center nearest to request region, and if the deadline of request is greater than the calculated threshold value, the request forwarded to the data center having minimum cost. Finally, the instruction 18 returns the selected data center ID based on the aforementioned criteria.
Results and discussion
This section presents results and discussion, baseline algorithms considered for comparison, and simulation tools selected for the experimentation.
Performance evaluation
This section presents the evaluation and comparison of the proposed COTD algorithm with the baseline algorithms available in Cloud analyst in terms of cost and response time. Following are the baseline algorithms that are used for the performance evaluation of COTD.
Service Proximity Based Routing: Service Proximity Based Routing (SPBR) broker algorithm is named as Closest Datacenter in the simulation tool. Service broker maintains a list of all data centers index by their region, whenever a new request is received, this policy queries to the service broker for destination data center, then closest data center broker pickups the closest data center in terms of latency from the maintained list and return the ID of the selected data center. SPBR uses simple techniques and forwards the requests to the closest data center and only considers the cost.
Performance Optimized Routing: Performance-Optimized Routing (POR) service broker in simulator cloud analyst named at an Optimized Response Time is an extension of SPBR service broker that maintains a list of all available data centers index by their region, whenever a new request arrives, an optimized response time broker iterate with the list to estimate the current response time. If the current response time is better than the closest response time, then it is selected, otherwise ID of the the closest data center is returned. Since, POR technique is the extension of the SPBR technique, POR technique is also a simple technique and focuses on response time only and forward the request to achieve minimum response time.
It is worth noting that the proposed algorithm considers total cost along with the response time. The total cost is comprised of VM, storage, and data transfer cost. Cost is defined as an expense to process a request; this cost is the sum of the cost to VM, data transfer, and storage. While response time is defined as the total time a user generates a request and receives a reply or it can be defined as the sum of request processing time and data transfer time.
Simulation setup
For simulation and execution of the proposed algorithm, Corei5 laptop machine with 16 GB of RAM and Cloud Analyst [10] simulator is used. Cloud Analyst is the extension of CloudSim [35] and built on top of CloudSim. Cloud Analyst is designed for the simulation of a large-scale cloud application in a geographically distributed environment. The simulator is do the analysis of the proposed work in different scenarios by varying different parameters, contrary to the simuations the real world scenarios are expensive and time comsuing to get the results. Changind the different parameters are quite easy and fast to get an overall performance analysis of an algorithm. In the simulator, numerous requests from the user bases to create internet traffic were generated. Stimulator provides a GUI environment for the setup of a stimulating environment with a wide range of functions in the user base and data center setting. The stimulation duration is set at 60 minutes. Figure 4 shows the preview of cloud Analyst. Userbases lie in these regions produced the requests having a maximum deadline. A brief description of each designed scenario is presented in following subsections.

Main view of Cloud Analyst
Test scenarios
For evaluation purpose, the proposed technique is applied to three different scenarios and run multiple times to get accurate results. For this purpose, we run the proposed algorithm multiple times and take the average results. In the simulation, due to limitation of the request deadline, three regions (region0, region1, and region2) are selected on a priority basis and considered that all the userbases lie in that region produce the request having a minimum deadline and user bases in the remaining three regions (region3, region4 and region5) are considered to be low priority.
Scenario 1: 2 User Base 1 datacenter in each region
The simulated world is geographically divided into six regions, in the scenario 1, we distributed the user bases and data centers around the globe in the 6 regions. In the first scenario, we placed a single data center and 2 User Bases in each region, all the user bases have the same configuration and all the data centers have the same hardware configuration but have a different cost configuration. The purpose of this scenario is to draw a real-life example, just like a real-world scenario where we have more user bases as compared to the number of data centers. Figure 5 describes the design and configuration of the scenario 1.

Design of scenario 1 (2UB and 1 DC in each Region)
Scenario 2: 1 User Base and 2 datacenter in each region
In the second scenario, the two data centers and a single user base in each region is considered where all the user bases have the same configuration and all the data centers have the same hardware configuration but have a different cost configuration. The scenario 2, is opposite of the scenario 1. The purpose of this scenario is to determine, if new data centers are added to decrease the load, then how the proposed technique performs and what is the impact on response time and cost of increasing the number of data. In the second scenario, the data centers are more than the number of user bases. Figure 6 shows design and configuration of the scenario 2. From the figures, it can be concluded that there are large number of data centers to compute the tasks, whereas a little data for computation is available, thus data centers are not overburdened.

Design of scenario 2 (1 UB 2 DC in each Region)
Scenario 3: 4 User Base and 1 DC in each region
In a third scenario, the single data center and multiple User bases in each region are considered. All the user bases have the same hardware configuration and similarly, all the data centers have the same hardware configuration but have a different cost configuration. In the third scenario, the total number of data centers and placement of data centers in the regions remain the same just like scenario 1. In the case of users, bases are doubled the total number of user bases and fix 4 user bases in each region’s total of 24 user bases. The purpose of third scenario is to expand the already designed scenario 1, just like a real-world scenario with an increasing number of user bases as compared to the number of data centers. The purpose of this technique is to view the behavior of the proposed technique, how our proposed algorithm and baseline algorithms behave if the load is increased and, what is the impact on cost and response time if load increases. Figure 7 shows scenario 3.

Design of scenario 3 (4 UB 1 DC in each Region)
Simulation parameters
In the simulations, the data centers of each region having different cost configurations i.e., Cost per VM, cost per memory, cost per storage, and cost per data transfer. The purpose to set the different cost is to portray a real scenario because in different regions of the world cost ratio may vary (electric city cost, labor cost, infrastructure cost). Table 3 shows the default parameters of the simulation.
Results and analysis
In this Section, the above-described scenarios are implemented and run on a cloud Analyst simulator. After conducting multiple tests on a simulator average results are computed and presented in Table 4. The computed results show that, in all the scenarios the proposed COTD technique achieves the best results and saves the maximum cost as compared tobaseline techniques. In the scenario 1, the total cost of baseline and the proposed technique is compared and achieved 43% decrease in total cost. In scenario 2, a 22 % decrease in total cost is achieved. In case of 3rd scenario, 46% decrease in total cost is achieved. Finally, an average in decrease of cost is recorded 35%. It proves the proposed policy saves maximum cost as compared to the two baseline techniques. It is also observed from the results that an increase in data centers causes a huge increase in cost. On the other hand, when the proposed technique is compared with baseline techniques in terms of response time, the results listed in Table 4 shows that in the proposed technique response time increase is nominal that is because of proposed technique selects the datacenter having minimum cost, instead of closest datacenter and network delays may added in the response time. The percentage values on average, are less than a 1% increase in overall response time. According to the computed results, the proposed technique saves maximum costs and also maintains response time.
The results presented in Table 4 show a comparative analysis of baseline technique in selectedscenarios. Although response time of proposed technique is almost the same however a significant decrease in the cost is noted, because of the designed scenarios, where the user base, and data center configuration (number of requests, peak hours, and hardware) are the same and set on default. Since the proposed technique focuses to minimize the cost hence only cost configuration is changed and rest of the settings kept same. Thus COTD saves the maximum cost and maintain response time in the heterogeneous cost configuration environment.
According to the computed results of scenario 1, 2 and 3, the proposed technique saves maximum cost and performs the execution of all the tasks on a minimum possible cost. The cost breakup generated by simulating it, shows that in all scenarios proposed technique selects the data centers having minimum VM cost so that maximum cost can be saved.
The comparative response time results of the proposed technique and two baseline techniques in the scenarios discussed above are presented in Fig. 8.
Figure 8 shows that in proposed technique response time is better as compared to the other two algorithms. This increase is not significant, because COTD selects data centers having minimum cost instead of closest data center and addition of network delays.

Response Time comparison of three scenarios
Figure 9, shows the results of cost for the three designed scenarios with 2 baseline and the proposed algorithm. It is obvious from the graph that the proposed technique minimizes the maximum cost with a very small increase in response time.

Cost comparison of three scenarios
The purpose of the following graphs presented in Figs. 10 and 11 is to show the performance of the proposed algorithm by varying UB and DC and impact on cost. In Fig.10, the results of cost with increasing the number of DC are presented. The cost of COTD is comparatively less as compared to the other two baseline algorithms even DC is increased.

Impact of COTD on cost in varying DC

Impact of COTD on cost in varying UB
Figure 10 shows, that with 6 data centers the total cost is 7.35, if the DC becomes 12 then the total cost is 13.88. Consequently, by increasing the number of data centers in a simulator, there is a very significant increase in total cost. This shows that with the increase in the number of data centers to facilitate maximum requests instead of utilizing the available resources on their full capacity, cost factor is also disturbed and a major increase in overall cost is recorded.
The comparative results of increasing User Bases and its impact on cost are shown in Fig.11. According to the results, if there are 12 UB, the total cost is 8.17, and if UB is doubled in number then the total cost is 9.83. It is concluded that if the number of UBs increases there is very little impact on the total cost.
The proposed algorithm is also analyzed to verify it’s scalibilty. The performance of COTD is compared with the other algorithms with increasing user requests. In these simualtions, the data centers and user bases are fixed to 24, however the user requests are increased from 2K to 10K. The computed results are presented in Fig. 12 which shows that COTD outperformed by providing reduced cost to 22% on average. According to the results, the performance is significant in terms of cost because the proposed algorithm classifies the user requests based on the deadlines and capabilities of aviable DCs. However, the high priority requests with short deadlines are only processed at high costs in order to provide the minimum response time. On the other hand, those request which can be delayed are processed at minimum cost that eventually reduces the overall cost.

Impact of COTD on cost increasing user requests
Figure 13 presents the comparison of the number of deadline violations of COTD and baseline algorithms. The comparison shows that there is a significant difference in the number of violations of the proposed algorithmand SPBR and POR methods. The proposed algorithm perfroms better as the deadline violations of user requests are less as compared to other algorithms.

Comparison of deadline violations with increasing requests
Conclusion
The deadline-based service broker technique is proposed for the optimal cost that maintains response time in a cloud fog environment. The proposed technique exploits an algorithm consists of three steps including: 1) Threshold calculation for the selection of data centers, 2) Comparison of the deadline with minimum response time to ensure the availability of resources, and 3) Selection of the datacenter while comparing the deadline with a calculated threshold value. The proposed technique is implemented on three different scenarios and achieved the comparative results. According to the results, the proposed technique achieved over 34% average cost decrease than baseline techniques. In the case of response time, the proposed technique achieved almost similar results in comparison to the baseline algorithms where approximately 35% of the total average cost is saved with less than 1% increase in response time. In this reseach work mainly the cost is optimized while mainataining the response time of the requests. In future work, more complex scenarios will be considers and besides simualtions experiments in real world environments will be carried out.
References
Donnell NMC, Howley E, Duggan J (2020) Dynamic virtual machine consolidation using a multi-agent system to optimise energy efficiency in cloud computing. Futur Genre Comput Syst 108:288–301. https://doi.org/10.1016/j.future.2020.02.036
Chen S, Huang S, Luo Q, Zhou J (2020) A profit maximization scheme in cloud computing with deadline constraints. IEEE Access 8:118924–118939. https://doi.org/10.1109/ACCESS.2020.3003799
Chen S, You Z, Ruan X (2020) Privacy and energy co-aware data aggregation computation offloading for fog-assisted IoT networks. IEEE Access 8:72424–72434. https://doi.org/10.1109/ACCESS.2020.2987749
Choudhari T, Moh M, Mo TS (2018) Prioritized task scheduling in fog computing. Proc. ACMSE 2018 Conf 2018. https://doi.org/10.1145/3190645.3190699
“Cloud Computing Architecture.” [Online]. Available: http://www.eurocloud.org.uk/wp-content/uploads/2018/03/Cloud-Computing-1.jpg
Alharbi HA, Elgorashi TEH, Elmirghani JMH (2020) Energy efficient virtual machine placement over cloud-fog network architecture. IEEE Access 8:94697–94718. https://doi.org/10.1109/ACCESS.2020.2995393
Yousefpour A, Ishigaki G, Jue JP (2017) Fog Computing: Towards Minimizing Delay in the Internet of Things. Proc. - 2017 IEEE 1st Int. Conf. Edge Comput. EDGE 2017:17–24. https://doi.org/10.1109/IEEE.EDGE.2017.12
Scarlet O, Nardelli M, Schulte S, Dustdar S (2017) Towards QoS-Aware Fog Service Placement. Proc. - 2017 IEEE 1st Int. Conf. Fog Edge Comput. ICFEC 2017:89–96. https://doi.org/10.1109/ICFEC.2017.12
Iotti N, Picone M, Crane S, Ferrari G (2017) Improving quality of experience in future wireless access networks through fog computing. IEEE Internet Comput 21(2):26–33. https://doi.org/10.1109/MIC.2017.38
Khan MA (2020) Optimized hybrid service brokering for multi-cloud architectures. J Supercomput 76(1):666–687. https://doi.org/10.1007/s11227-019-03048-5
Wickremasinghe B, Calheiros RN, Buyya R (2010) CloudAnalyst: a cloudsim-based visual modeller for analysing cloud computing environments and applications. Proc - Int Conf Adv Inf Netw Apple AINA:446–452. https://doi.org/10.1109/AINA.2010.32
Tyagi V, Kumar T (2015) ORT broker policy: reduce cost and response time using throttled load balancing algorithm. Procedia Comput. Sci. 48:217–221. https://doi.org/10.1016/j.procs.2015.04.173
Ramasubbareddy S, Adityasaisrinivas T, Govinda K, Manivannan SS, Swetha E (2019) Analysis of load balancing algorithms using cloud analyst. Int J Recent Technol Eng 7(6):684–687
Naha RK, Othman M (2016) Cost-aware service brokering and performance sentient load balancing algorithms in the cloud. J Netw Comput Appl 75:47–57. https://doi.org/10.1016/j.junkie.2016.08.018
Manasrah AM, Aldomi A, Gupta BB (2019) An optimized service broker routing policy based on differential evolution algorithm in fog/cloud environment. Cluster Comput. 22:1639–1653. https://doi.org/10.1007/s10586-017-1559-z
Kulkami AK, Annappa B (2017) Cost aware service broker algorithm for load balancing Geo-distributed data centers in the cloud. 2017 IEEE Int. Conf. Signal Process. Informatics, Commun Energy Syst SPICES. https://doi.org/10.1109/SPICES.2017.8091337
Jain R, Sharma N, Sharma T (2018) Enhancement in performance of the service broker algorithm using fuzzy rules. Proc. 2nd Int. Conf. Invent. Syst. Control. ICISC 2018:922–925. https://doi.org/10.1109/ICISC.2018.8398934
Rekha PM, Dakshayini M (2018) Dynamic cost-load aware service broker load balancing in virtualization environment. Procedia Comput. Sci. 132:744–751. https://doi.org/10.1016/j.procs.2018.05.086
Patel R, Patel S (2019) Efficient service broker policy for intra data center load balancing, vol 107. Springer, Singapore
Al-Tarawneh M, Al-Mousa A (2019) Adaptive user-oriented fuzzy-based service broker for cloud services. J. King Saud Univ. - Comput. Inf. Sci. https://doi.org/10.1016/j.jksuci.2019.11.004
Benlalia Z, Beanie-Hssane A, Abouelmehdi K, Ezati A (2019) A new service broker algorithm optimizing the cost and response time for cloud computing. Procedia Comput Sci 151(2018):992–997. https://doi.org/10.1016/j.procs.2019.04.139
Nayak SC, Parida S, Tripathy C, Pattnaik PK (2018) An enhanced deadline constraint based task scheduling mechanism for cloud environments. J. King Saud Univ. - Comput. Inf. Sci. https://doi.org/10.1016/j.jksuci.2018.10.009
Jyoti A, Shrimali M (2020) Dynamic provisioning of resources based on load balancing and service broker policy in cloud computing. Cluster Comput 23(1):377–395. https://doi.org/10.1007/s10586-019-02928-y
Junaid M, Sohail A, Ahmed A, Baz A, Khan IA, Alhakami H (2020) A hybrid model for load balancing in cloud using file type formatting. IEEE Access 8:118135–118155. https://doi.org/10.1109/ACCESS.2020.3003825
Ghasemi A, Trophy Haghighat A (2020) A multi-objective load balancing algorithm for virtual machine placement in cloud data centers based on machine learning. Computing 102(9):2049–2072. https://doi.org/10.1007/s00607-020-00813-w
Junaid M et al (2020) Modeling an optimized approach for load balancing in cloud. IEEE Access 8:173208–173226. https://doi.org/10.1109/access.2020.3024113
Shahriar Maswood MM, Rahman MR, Alharbi AG, Medhi D (2020) A Novel Strategy to Achieve Bandwidth Cost Reduction and Load Balancing in a Cooperative Three-Layer Fog-Cloud Computing Environment. IEEE Access 8:113737–113750. https://doi.org/10.1109/ACCESS.2020.3003263
Gupta P, Kaikini RR, Saini DK, Rahman S (2022) Cost-aware resource optimization for efficient cloud application in smart cities. Journal of Sensors 2022:1–12. https://doi.org/10.1155/2022/4406809
Najafizadeh A, Salajegheh A, Rahmani AM, Sahafi A (2022) Multi-objective task scheduling in cloud-fog computing using goal programming approach. J Clus Comput 25:141–165
Bezdan T, Zivkovic M, Bacanin N, Strumberger I, Tuba E, Tuba M (2021) Multi-objective task scheduling in cloud computing environment by hybridized bat algorithm. In: Book: Intelligentand fuzzy techniques: smart and innovative solutions
Sandhu AK (2021) Big data with cloud computing: discussions and challenges. Big Data Analytics 5(1):32–40
Liu H, Aljbri AS, Song J, Jiang J, Hua C (2021) Research advances on AI-powered thermal management for data centers. Tsinghua Sci Technol 27(2):303–314
Nath S, Jingxian W (2020) Deep reinforcement learning for dynamic computation offloading and resource allocation in cache-assisted mobile edge computing systems. Intelligent and Converged Networks 1(2):181–198
Zhang W, Chen X, Jiang J (2020) A multi-objective optimization method of initial virtual machine fault-tolerant placement for star topological data centers of cloud systems. Tsinghua Sci Technol 26(1):95–111
Calheiros RN, Ranjan R, Beloglazov A, De Rose CAF, Buyya R (2011) CloudSim: a toolkit for modeling and simulation of cloud computing environments and evaluation of resource provisioning algorithms. Softw - Pract Exp 41(1):23–50
“Fog-Computing-diagram.” [Online]. Available: https://www.itprc.com/wp-content/uploads/2018/09/Fog-Computing-diagram.jpg
Ben Alla H, Ben Alla S, Touhafi A, Ezzati A (2018) Deadline and Energy Aware Task Scheduling in Cloud Computing. 4th Int. Conf Cloud Comput Technol Apple Cloudtech 2018:1–8. https://doi.org/10.1109/CloudTech.2018.8713338
Acknowledgements
The authors would like to thank the anonymous reviewers for their insightful comments and suggestions on improving this paper.
Availability of supporting data
The datasets used during the current study are available on reasonable request.
Funding
This research was partially supported by the SAFE_RH project under Grant No. ERASMUS+ CBHE - 619483-EPP-1-2020-1-UK-EPPKA2-CBHE.
Author information
Authors and Affiliations
Contributions
The main manuscript text is written by Saima Gulzar, figures are developed by Ehsan Ullah Munir and Naeem Ramzan worked on the results section. Tassawar Iqbal performed simulations again and included few more results. All authors reviewed and improved the writeup of the manuscript. All authors read and approved the final manuscript.
Corresponding author
Ethics declarations
Ethics approval and consent to participate
Not Applicable.
Consent for publication
All authors guarantee that research findings have not been previously published and this work is not submitted any whereelse.
Competing interests
The authors declare that they have no competing interests.
Additional information
Publisher’s Note
Springer Nature remains neutral with regard to jurisdictional claims in published maps and institutional affiliations.
Rights and permissions
Open Access This article is licensed under a Creative Commons Attribution 4.0 International License, which permits use, sharing, adaptation, distribution and reproduction in any medium or format, as long as you give appropriate credit to the original author(s) and the source, provide a link to the Creative Commons licence, and indicate if changes were made. The images or other third party material in this article are included in the article's Creative Commons licence, unless indicated otherwise in a credit line to the material. If material is not included in the article's Creative Commons licence and your intended use is not permitted by statutory regulation or exceeds the permitted use, you will need to obtain permission directly from the copyright holder. To view a copy of this licence, visit http://creativecommons.org/licenses/by/4.0/.
About this article

Cite this article
Ahmad, S.G., Iqbal, T., Munir, E.U. et al. Cost optimization in cloud environment based on task deadline. J Cloud Comp 12, 9 (2023). https://doi.org/10.1186/s13677-022-00370-x
Received:
Accepted:
Published:
DOI: https://doi.org/10.1186/s13677-022-00370-x